


A Bear Market Is Coming Eventually. History Says This Is a Key Warning Sign to Look For.
Key Points
The stock market has been thriving in recent years, but that can result in a sneaky risk.
Elevated valuations have historically preceded previous bear markets.
Investing in the right places is key to surviving a market downturn.
- 10 stocks we like better than S&P 500 Index ›
The past few years have been lucrative for the stock market, as the S&P 500 (SNPINDEX: ^GSPC), Nasdaq Composite (NASDAQINDEX: ^IXIC), and Dow Jones Industrial Average (DJINDICES: ^DJI) have all reached record high after record high.
But no bull market can last forever. Historically, the average S&P 500 bull market since 1929 has lasted over 1,000 days, or just under three years, according to analysis from Bespoke Investment Group. We're now nearing the fourth anniversary of the current bull market, which officially began in October 2022.
Missed Nvidia in 2009? This Rare Signal Is Flashing Again. In 2009, a "Double Down" signal flashed for a little-known chipmaker called Nvidia. For the first time in years, that same "Total Conviction" signal is flashing for a company 1/100th the size of Nvidia. Continue »
To be clear, no one can predict when a market will begin, and there's a chance we could still have many more months or even years of growth before the next downturn. But a bear market is coming eventually, and history suggests it could arrive sooner rather than later.
Image source: Getty Images.
History is flashing a warning right now
The sneaky downside to a record-breaking market is that stocks become pricier. In some cases, they can also become overvalued -- meaning their price no longer aligns with their intrinsic value. While some overvalued stocks can still climb in the short term, they often deliver lower returns over time as the market corrects itself.
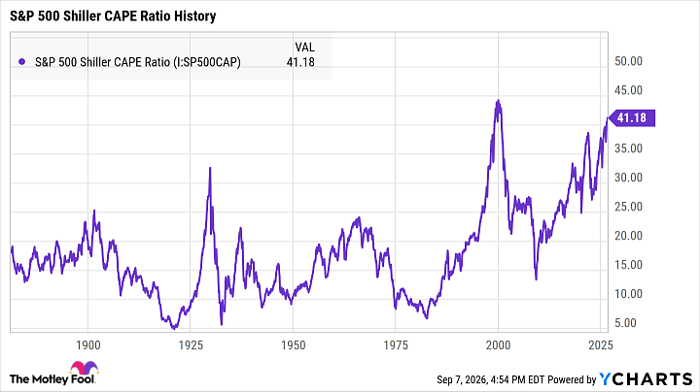
Valuations can be tricky to pin down, as investors will often have different ideas of what's considered "overvalued." However, one valuation metric that has predicted some of history's worst bear markets is the S&P 500 Shiller CAPE Ratio.
This indicator measures the S&P 500's 10-year inflation-adjusted earnings, providing an overview of long-term valuation trends. A higher ratio suggests a more richly valued market, and historically, stock prices tend to fall in the years following a peak.
S&P 500 Shiller CAPE Ratio data by YCharts
Since 1871, there have been two instances in which this metric suddenly spiked: the Great Depression in 1929 and the dot-com bubble burst in 2000. In both cases, this ratio surged to unprecedented territory just months before a severe economic downturn began. As of this writing, this metric sits at 41 -- its second-highest level in history.
Now, this doesn't necessarily mean that history is on a path to repeating itself. Every bear market is different, and no stock market indicator will be 100% accurate. Historically speaking, though, it's rare for the market to be as richly valued as it is right now, and investors would be wise to prepare for a pullback.
The single best move investors can make right now
The broader market may be expensive right now, but that doesn't mean investors should shy away from buying. It is crucial, however, to choose your investments wisely.
Whenever the next bear market begins, stocks from weak companies will be hit the hardest. The dot-com bubble is a prime example of this, as hundreds of tech stocks skyrocketed in value in the late 1990s only to crumble under the weight of a recession and go bankrupt just a few years later.
Bear markets are major stress tests for companies. It's sometimes possible to get away with an unsustainable business model or poor leadership when the overall market is thriving, but companies with shaky foundations will struggle the most to survive tough economic times.
If there's just one move all investors should make right now, it's to ensure you're only investing in quality stocks with robust business fundamentals. Strong companies make for the most lucrative investments, and with a portfolio full of healthy stocks, you'll be prepared for whatever volatility may be coming.
Should you buy stock in S&P 500 Index right now?
Before you buy stock in S&P 500 Index, consider this:
The Motley Fool Stock Advisor analyst team just identified what they believe are the 10 best stocks for investors to buy now… and S&P 500 Index wasn’t one of them. The 10 stocks that made the cut could produce monster returns in the coming years.
Consider when Netflix made this list on December 17, 2004... if you invested $1,000 at the time of our recommendation, you’d have $421,997!* Or when Nvidia made this list on April 15, 2005... if you invested $1,000 at the time of our recommendation, you’d have $1,413,876!*
Now, it’s worth noting Stock Advisor’s total average return is 978% — a market-crushing outperformance compared to 213% for the S&P 500. Don't miss the latest top 10 list, available with Stock Advisor, and join an investing community built by individual investors for individual investors.
See the 10 stocks »
*Stock Advisor returns as of September 9, 2026.
Katie Brockman has no position in any of the stocks mentioned. The Motley Fool has no position in any of the stocks mentioned. The Motley Fool has a disclosure policy.
Recommended Articles


