


Oracle Stock Price Forecast: Wins Citi Bullish Call After 50% Pullback, Can the Stock Recover?
TradingKey - Oracle (ORCL) stock has experienced a sharp pullback since peaking on June 1, dropping from an interim high of $249 all the way to $114.5. This decline represents 4 to 5 standard deviations of Oracle's historical volatility level, with technical factors such as concentrated investor selling, widening credit spreads, and at-the-market offerings jointly exacerbating downward pressure on the stock price.
However, the sharp drop in Oracle's stock price does not entirely mean that the fundamentals of its AI cloud business have deteriorated.
On the contrary, the core question the market is currently re-evaluating is whether the company can convert its massive AI computing orders into actual revenue, profits, and cash flow. Oracle added over $85 billion in new backlog orders during the May quarter, far exceeding the approximately $9 billion in new orders added by emerging cloud service providers over the same period, indicating that demand for AI infrastructure remains strong.
Therefore, Oracle's current core conflict has shifted from "whether AI demand exists" to "whether the company can complete infrastructure delivery at a controllable cost of capital and convert its order backlog into sustained revenue and earnings growth."
If the earnings report and Investor Day can further ease market concerns regarding capital expenditures, financing needs, and cash flow, this deep pullback could serve as the starting point for Oracle's valuation recovery; conversely, if the pace of order conversion falls short of expectations, the stock price may remain under pressure.
Citi Sees Investment Opportunity in Oracle
Citi noted that Oracle has presented an investment opportunity following a steep decline, ahead of its earnings report and late-October investor day.
Citi pointed out that Oracle's stock price has significantly underperformed nearly all megacap tech stocks over the past three months, falling more than 50% from peak to trough within 30 to 40 days, equivalent to 4 to 5 standard deviations of historical volatility levels. Technical factors, including investor capitulation, credit spreads, and at-the-market equity offerings, combined to exacerbate the sell-off.
Citi believes market expectations have reset, forced selling pressure may have passed, and bond and credit default swap spreads are recovering. Meanwhile, second-quarter updates from neocloud providers show that robust demand is driving pricing and margins higher, with Oracle's newly signed contracts expected to reap similar gains; the company added over $85 billion in new backlog during the May quarter, far exceeding the approximately $9 billion level for neocloud providers.
Based on this, Citi raised its revenue and earnings forecasts for Oracle for fiscal years 2028 to 2030, increasing its FY2030 EPS forecast to $22—higher than Oracle's own target of $21 and the market consensus of around $20—while maintaining its price target of $330.
Wall Street Average Price Target Is $257
Although Oracle's stock price experienced a pullback of up to 50%, multiple Wall Street investment banks remain highly optimistic about its prospects, giving it an overall consensus rating of "Strong Buy".
Data from TipRanks shows that a total of 32 analysts have rated Oracle over the past 3 months, with a high price target of $400, representing an upside potential of about 171% from the current price; the low price target is $145.00, which is only about 2% lower than the current price of $147. The average price target is $257.79, which is also significantly higher than the current price.
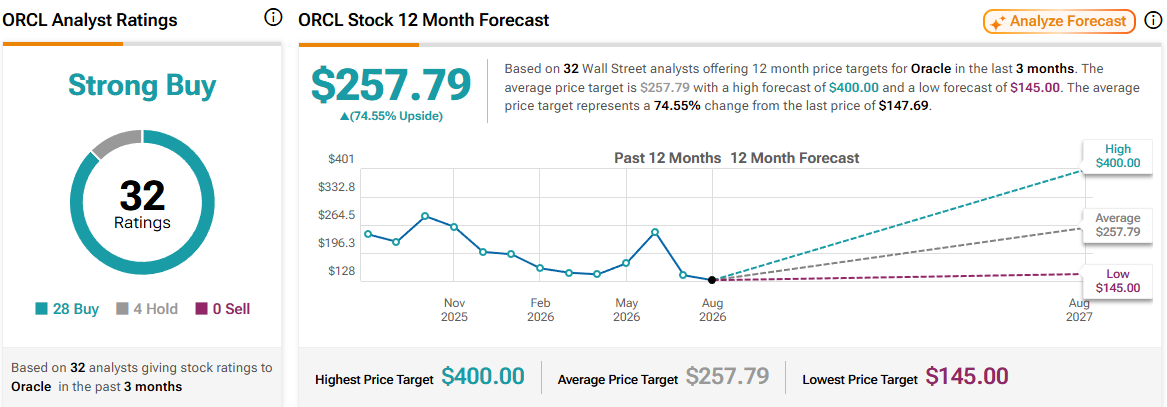
Source: Tipranks
On August 21, Mizuho analyst Siti Panigrahi reaffirmed an "Outperform" rating on Oracle and maintained a $320 price target. It is reported that the U.S. Department of Veterans Affairs recently raised the contract ceiling for Oracle's Oracle Health electronic health record modernization project by approximately $17 billion to nearly $27 billion, adding three optional one-year order periods, with the agreement extending up to May 2031.
The firm believes that the contract expansion significantly enhances long-term revenue opportunities for Oracle Health, helps support Oracle's SaaS business growth over the next few years, and complements the expansion of its OCI cloud infrastructure business.
Oracle Technical Analysis: $155 Is Key Resistance Level
After halting its fall near $114.50, Oracle first rebounded rapidly and then consolidated sideways around $143–$152. Recently, the price reclaimed the 20-day moving average, 80-day moving average, and the 0.382 Fibonacci retracement level ($145.37), indicating that buying support below remains intact and the short-term trend has shifted from a weak downside probe to a range-bound bias with a bullish tilt.
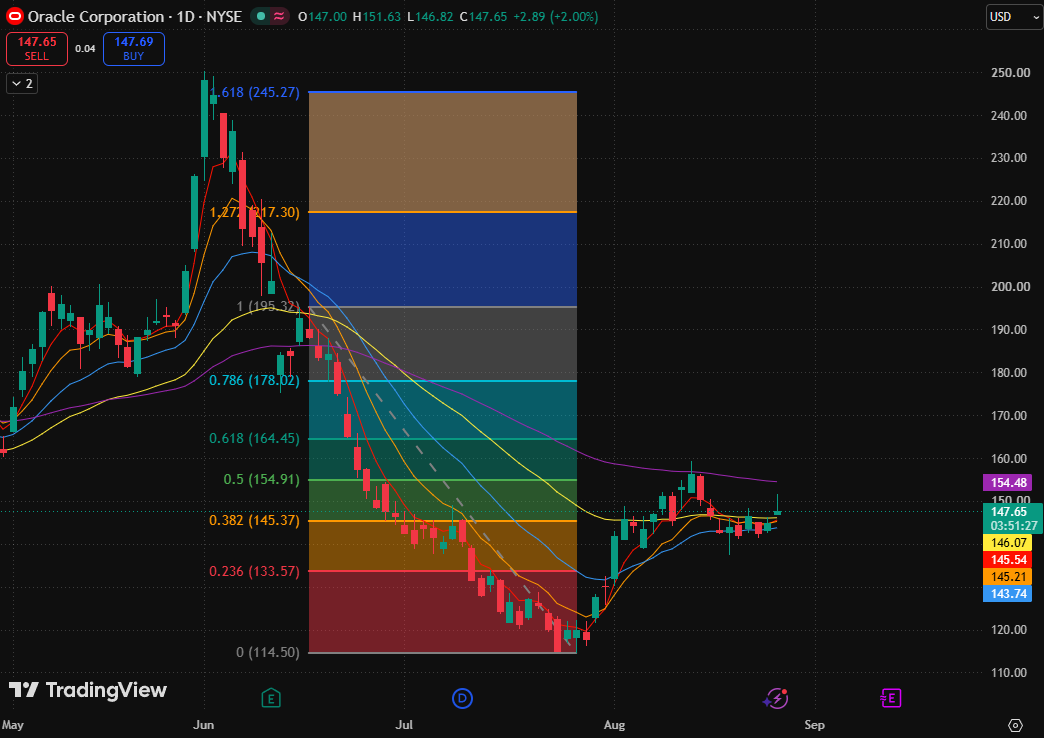
Oracle stock price chart, Source: TradingView
It should be noted that the 5-day, 10-day, 20-day, and 80-day moving averages remain relatively concentrated, while the 160-day moving average ($154.48) continues to weigh from above, and the moving average system has not yet formed a clear bullish alignment.
The first key resistance above is the pressure zone formed by the 160-day moving average ($154.48) and the 0.5 Fibonacci retracement level ($154.91). If the daily chart can consecutively close firmly above $154.91 and hold during pullbacks, upside room would open up toward the 0.618 Fibonacci retracement level ($164.45).
If it encounters resistance again in this region, it will likely remain oscillating within the $145–$155 range. If both the 20-day moving average ($143.74) and the $145.37 support zone fail to hold, the short-term rebound structure will be significantly weakened, and the focus of downside retracement will shift to the 0.236 Fibonacci retracement level ($133.57); if lost further, caution is required against a retest of the low near $114.50.
Recommended Articles


