


The S&P 500 Is Repeating an Ominous Pattern Not Seen in 26 Years. History Says This Is What Usually Happens Next, and Why This Time Could Be Different.
Key Points
The CAPE ratio is a valuation tool that helps measure whether the S&P 500 is expensive or reasonably priced.
Currently, the CAPE ratio is at its highest level since the dot-com bubble.
Elevated CAPE ratios have historically preceded market downturns.
- 10 stocks we like better than S&P 500 Index ›
The S&P 500 (SNPINDEX: ^GSPC) has been on a multiyear rally for some time now. Annual returns reached 24% in 2023, 23% in 2024, and 16% in 2025. Meanwhile, the index has climbed another 12% so far this year.
These consecutive years of robust double-digit gains have produced a compound annual growth rate well above the market's long-term historical average. As the market flirts with record levels, it's clear investors are both confident and willing to bid stock prices higher on expectations of sustained growth.
Missed Nvidia in 2009? This Rare Signal Is Flashing Again. In 2009, a "Double Down" signal flashed for a little-known chipmaker called Nvidia. For the first time in years, that same "Total Conviction" signal is flashing for a company 1/100th the size of Nvidia. Continue »
While optimism fuels capital allocation, excessive exuberance can risk leaving valuations vulnerable if earnings or economic conditions disappoint. With that in mind, investors now face a classic tension: follow the momentum or employ some discipline to avoid overcommitment at elevated levels.
Understanding the market's current valuation profile
The cyclically adjusted price-to-earnings ratio, or CAPE ratio, is a valuation tool developed by economist Robert Shiller. The CAPE is calculated by dividing the price of the S&P 500 by the last 10 years of inflation-adjusted earnings. The idea is that by smoothing out cyclical fluctuations in corporate profits, CAPE readings provide a more accurate gauge of valuation that is less distorted by short-term swings than the more commonly used trailing price-to-earnings multiple. Elevated CAPE readings are historically associated with lower returns and a higher vulnerability to corrections, making the metric a useful cautionary warning sign.
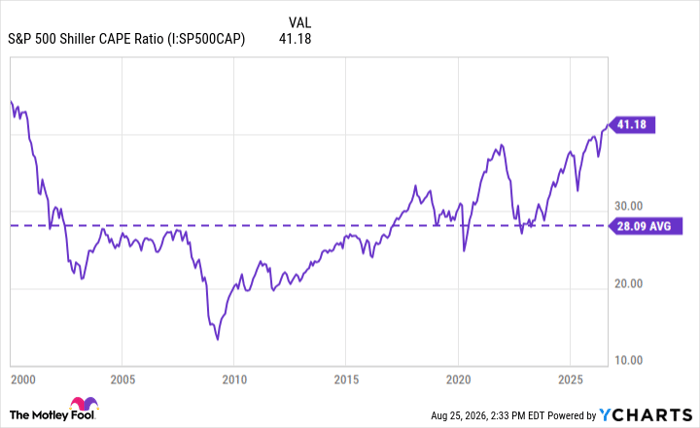
S&P 500 Shiller CAPE Ratio data by YCharts
Since 2000, the CAPE ratio has had an annual average of roughly 28. This figure is well above the long-term historical average of about 18. The peak reading, however, occurred at the turn of the millennium. Back in 1999, the CAPE ratio reached 44, its highest reading on record.
This coincided with the height of the dot-com bubble. At the time, investors were recklessly pouring capital into internet companies, many of which generated little or no profit -- instead trading on visions of future network effects. The inevitable compression of earnings relative to soaring stock prices produced an extreme CAPE reading and set the stage for the subsequent multiyear bear market.
Why the current market may be different than the dot-com boom
On the surface, the current market environment shares some obvious similarities with the late 1990s. A transformative technology -- artificial intelligence (AI) -- has once again captured the imagination of investors. Just like 26 years ago, investors are driving unprecedented price appreciation in the technology sector. As a result, the CAPE ratio has risen into territory historically associated with elevated risk.
I think the underlying fundamentals of the current market dynamics diverge from the dot-com era in some important ways, though. Many of the companies at the center of today's AI boom generate substantial free cash flow, maintain durable competitive advantages, and are aggressively deploying capital into infrastructure such as data centers and advanced semiconductors. The earnings profiles of these companies are not prospective; rather, they are already materializing in current financials.
By contrast, the late 1990s were littered with numerous unprofitable internet businesses. Big tech leaders now operate across established industries and are embedding AI into products and services that drive measurable productivity gains across the broader economy. This makes the technology industry's tailwinds inherently more secular, resting on a firmer foundation rather than the speculative narratives that dominated the early days of the internet.
Image source: Getty Images.
How to prepare your portfolio when the CAPE ratio rises
While elevated CAPE readings frequently precede market corrections, they do not provide an exact calendar for when prices may reverse. Investors can still benefit from preparing without attempting to time an exact peak.
One approach is to trim a portion of gains accumulated in the strongest rallies while retaining core exposure to your highest-conviction holdings. These should be businesses that combine durable competitive moats, diversified revenue streams, and reliable cash generation. Rebalancing your portfolio toward these types of companies reduces concentration risk without abandoning the stock market entirely. Moreover, maintaining adequate cash and always employing a multiyear investment horizon cushions the impact of any interim sell-offs.
While history cautions that frothy valuations often lead to sharp drawdowns, the secular forces supporting today's market differ from those that accompanied the peaks of two and a half decades ago. Thoughtful portfolio construction helps acknowledge valuation risk while also allowing you to remain invested in quality stocks, ultimately offering a balanced response to the current market.
Should you buy stock in S&P 500 Index right now?
Before you buy stock in S&P 500 Index, consider this:
The Motley Fool Stock Advisor analyst team just identified what they believe are the 10 best stocks for investors to buy now… and S&P 500 Index wasn’t one of them. The 10 stocks that made the cut could produce monster returns in the coming years.
Consider when Netflix made this list on December 17, 2004... if you invested $1,000 at the time of our recommendation, you’d have $439,308!* Or when Nvidia made this list on April 15, 2005... if you invested $1,000 at the time of our recommendation, you’d have $1,286,826!*
Now, it’s worth noting Stock Advisor’s total average return is 964% — a market-crushing outperformance compared to 212% for the S&P 500. Don't miss the latest top 10 list, available with Stock Advisor, and join an investing community built by individual investors for individual investors.
See the 10 stocks »
*Stock Advisor returns as of August 28, 2026.
Adam Spatacco has no position in any of the stocks mentioned. The Motley Fool has no position in any of the stocks mentioned. The Motley Fool has a disclosure policy.
Recommended Articles


