


Micron Stock Price Forecast: Trend Remains Bullish, Focus on $800 Support Level
TradingKey - As of the close on August 27 Eastern Time, Micron (MU) stock reached an intraday high of $968.71 before pulling back to close at $935.39, down 0.32% for the day. Judging from recent trends, Micron has weakened noticeably since touching a phase high of $1,036.13 on August 17. On August 24, it dropped as much as 5.83% to $910.43 at one point. Although it subsequently rebounded, it has temporarily failed to regain a firm footing in the $950–$1,000 range, remaining in a short-term consolidation phase at elevated levels.
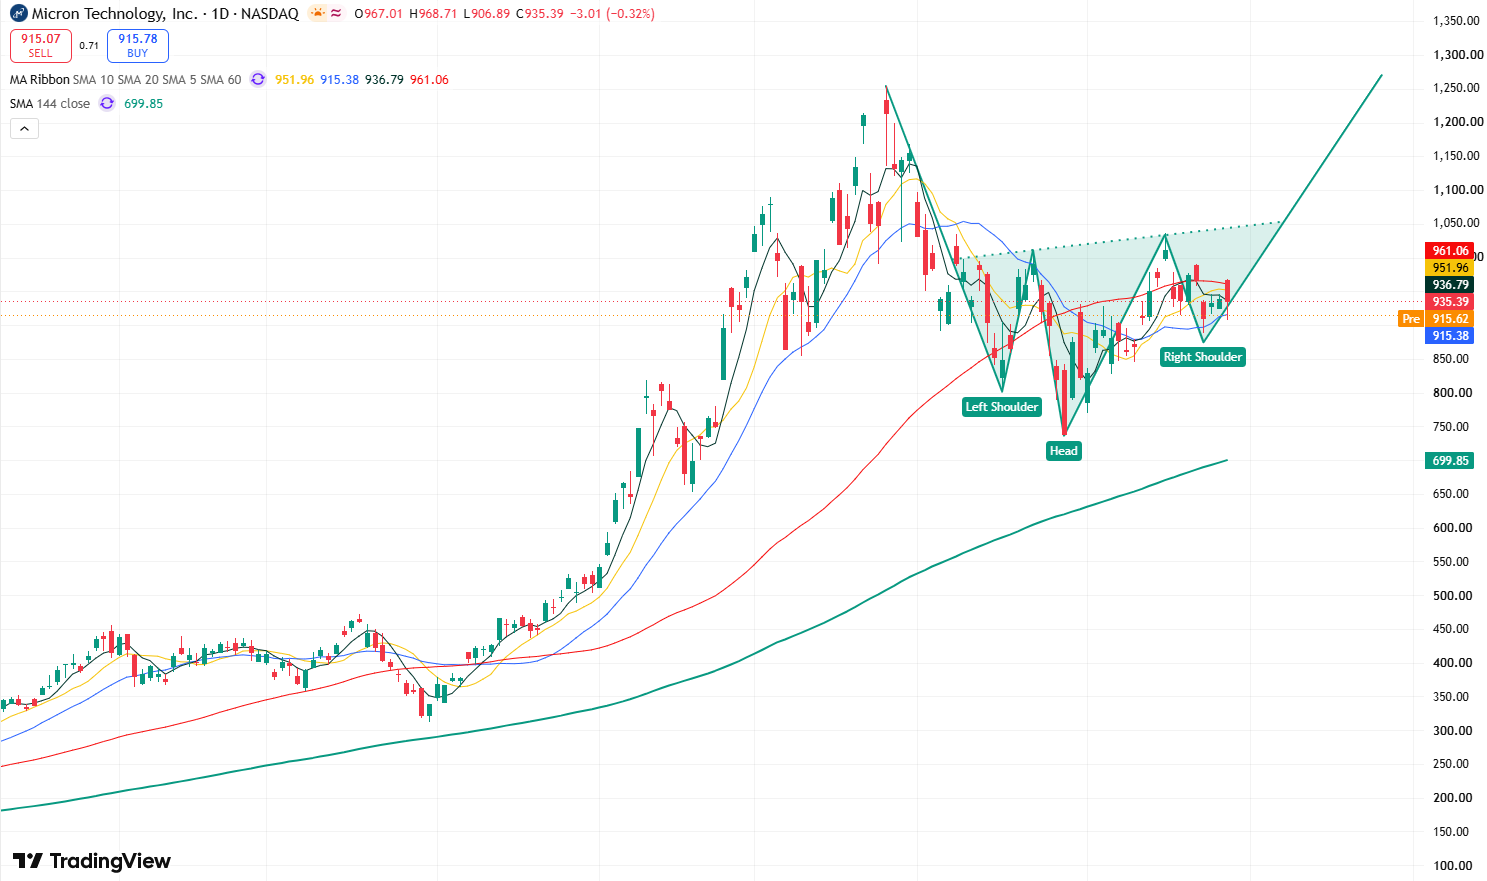
Micron daily stock chart, Source: TradingView
Judging from the daily chart of Micron's stock price, as the stock broke through the rebound high of $1,011.77 from July 23 on August 17, the recent candlestick pattern is expected to form a head-and-shoulders bottom structure. The left shoulder is near $800, and the head is the low of $739 set in late July. Currently, the neckline position of $1,011.77 has been broken; once the price completes a pullback without falling below $800, the right shoulder will be formed.
If the head-and-shoulders bottom structure forms, the stock's short-term bullish momentum will be significantly enhanced, with upside targets expected to test the all-time high of $1,255. A breakout above this level would open up further upside potential toward $1,400.
To the upside, the primary resistance level to watch is near $1,040. If the stock price breaks out and holds above this level, it will test the resistance level at $1,130, followed by the $1,255 resistance level further above.
To the downside, the first support level to watch is near $887. If the stock price falls below this level, it may test the key support level of $800. If this level fails to hold, it will open room for a deeper correction, potentially pulling back toward $740.
Recommended Articles


