


Nvidia Stock Price Forecast: How Much Upside Remains for NVDA as Annual Revenue Could Hit $1 Trillion?
TradingKey - A better-than-expected earnings report, combined with a long-term growth outlook far exceeding Wall Street forecasts, has prompted investors to reassess Nvidia's (NVDA) growth ceiling.
Nvidia shares surged 8.74% on Thursday to close at $227.98, marking its best post-earnings performance since May 2024. The company's market capitalization subsequently increased by approximately $441.5 billion to $5.49 trillion, setting a new single-day market cap gain record for Nvidia and marking the second-highest single-day market value increase for a public company in history.
During its earnings call, Nvidia provided an even more impactful early outlook: for fiscal year 2028 ending in January 2028, the company's revenue growth could exceed 70%, significantly above FactSet's previous consensus estimate of around 45%.
Raymond James analyst Simon Leopold further noted that it "seems possible" for Nvidia to achieve $1 trillion in revenue for the fiscal year ending in January 2029.
Nvidia’s Guidance May Still Be Conservative With 70% Growth in FY2028
Nvidia management stated that the growth projection of over 70% for fiscal year 2028 already accounts for current supply constraints. If the pace of expansion in memory, advanced packaging, and data center construction can accelerate further, the company's actual revenue could still exceed this initial forecast.
Based on analysts' estimated revenue of $403.5 billion for fiscal year 2027, if revenue grows by 70% in the following fiscal year, Nvidia's fiscal year 2028 revenue will approach $686 billion. To reach $1 trillion in fiscal year 2029, the company would subsequently need to achieve growth of approximately 46%. For a company whose revenue scale already exceeds hundreds of billions of dollars, this target remains aggressive, but it is not entirely detached from its current growth trajectory.
FactSet previously estimated that Nvidia's fiscal year 2029 revenue would be less than $750 billion. In other words, the $1 trillion forecast is at least $250 billion higher than the existing market consensus. Investors' willingness to re-rate valuations higher following the earnings report reflects that the market is beginning to believe Nvidia's growth cycle could be longer than previously expected.
TD Cowen analyst Joshua Buchalter believes that the outlook for over 70% growth in fiscal year 2028 is the catalyst needed to drive the stock price higher again. Since this forecast was made under supply-constrained conditions, its significance goes beyond growth figures exceeding expectations; it also signifies that management has gained high order visibility.
Goldman Sachs (GS) analyst James Schneider noted that Nvidia is working with technology companies and financial institutions to resolve data center construction, power, and financing bottlenecks. If these projects can accelerate the deployment of AI computing power, there remains potential for actual performance in fiscal year 2028 to exceed the company's initial forecast.
The strong forward outlook has also prompted Wall Street to reevaluate Nvidia's valuation. Following the earnings release, several institutions raised their price targets for Nvidia. Goldman Sachs raised its target price to $300, JPMorgan raised its to $320, and Mizuho bumped its target price to $315. Based on Nvidia's Thursday closing price of $227.98, these targets represent potential upside of approximately 32%, 40%, and 38%, respectively.
Raymond James provided an even more optimistic forecast, sharply raising Nvidia's target price from $352 to $550, which is about 141% above the latest closing price.
Nvidia Stock Technical Analysis: How Much Upside Is Left for NVDA?
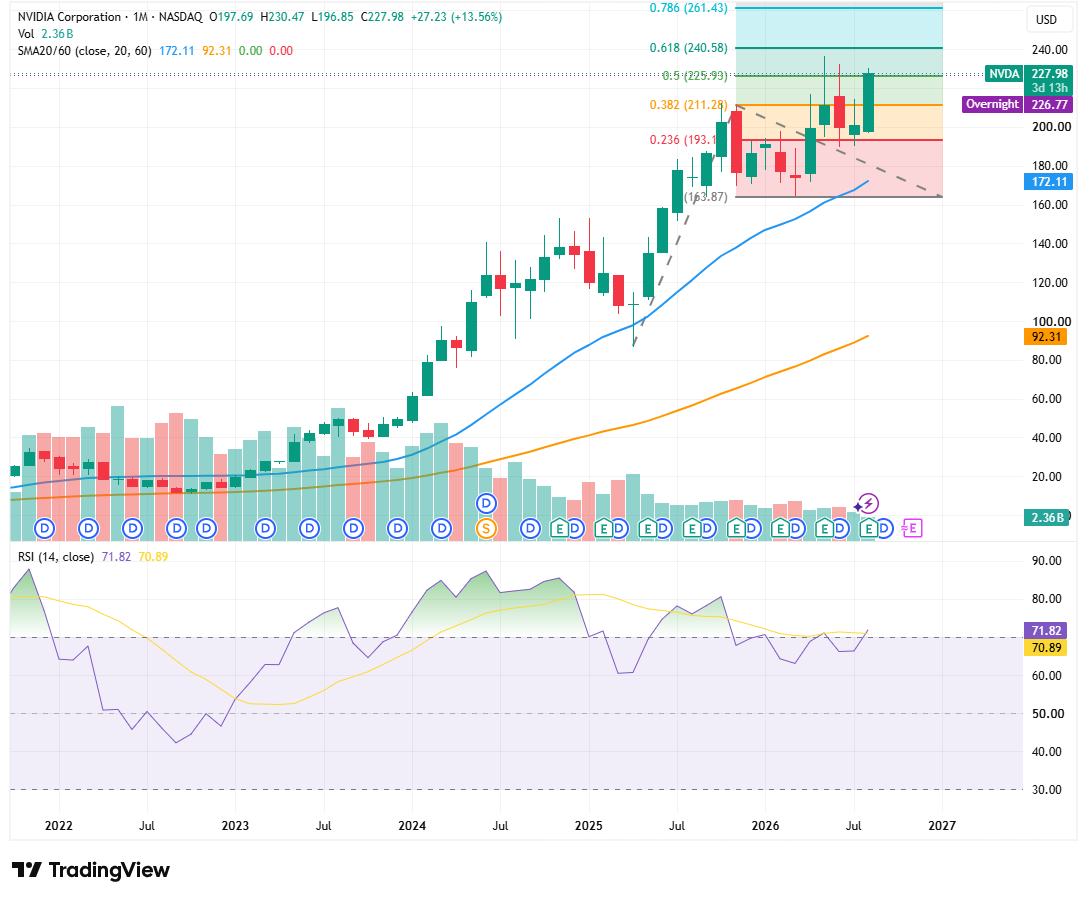
Source: TradingView
Looking at the monthly chart, Nvidia last closed at $227.98, having broken above the downtrend line and reclaimed the 0.5 Fibonacci extension level of $225.93. The stock price remains significantly above the 20-month moving average of $172.11 and the 60-month moving average of $92.31, with both moving averages continuing to slope upward, indicating that the long-term bullish trend remains solid.
The monthly RSI stands at 71.82, above the signal line of 70.89, showing that upside momentum remains strong, though it has entered overbought territory, suggesting potential high-level consolidation in the short term. As long as the monthly chart holds above $225.93, the next target is $240.58; a high-volume breakout could further pave the way to test $261.43, followed by the 1.0 extension target of around $290.
If the stock price falls back below $225.93, it may retest $211.28; if $211 is also breached, the correction could extend to $193.10. The 20-month moving average of $172.11 serves as a crucial line of defense for the long-term trend.
Recommended Articles


