


Microsoft (MSFT) Surged 8% After Earnings - Azure Hit 43%, Copilot 30M Seats, Capex Steady
TradingKey - Microsoft (NASDAQ: MSFT) posted a closing price of $390.54 on Tuesday. After the FY2026 Q4 reports, which beat all estimates, the price jumped in after-hours trading to $422.30, an 8.13% increase. Microsoft reported $90.01 billion in revenue, a year-on-year increase of 18% with an expected revenue of $87.62 billion. The non-GAAP EPS was reported to be $4.74, beating the expected EPS of $4.33 by $0.41.
Azure reported a 43% increase and surpassed $100 billion in annual revenue for the first time. 30 million paid commercial seats of Copilot were reported, as well as a reported 50 million commercial users of GitHub Copilot. A reporting increase in commercial RPO (Contracted Revenue Performance Obligations) of 84% to $678 billion was noted. The lack of an increase in CapEx guidance is important, as it shows a clear distinction in CapEx from Alphabet and Meta.
What the Numbers Said and Why the Market Reacted Differently Than Meta
Meta and Alphabet are at the heart of this comparison. Earnings were reported for all three within a 48-hour window. Alphabet was up 4.8% in earnings but fell 15%. Meta had a 1% increase in earnings, but subsequently fell 9.64%. However, Microsoft was also up in earnings by 2.7% and gained 8.13%. The difference did not rely on the magnitude of the earnings; it was the capex framework. Alphabet increased the yearly estimate to $195 to $205 billion, and Meta increased their estimate to $130 to $145 billion.
Whereas, Microsoft held their capex framework with no significant change, and $41 billion for Q4 was in the $40 billion guidance. Microsoft management also commented that there was still demand for services which was greater than the supply. They also provided guidance for positive revenue and operating income growth in FY2027 of a double-digit nature. This provided the investors with the context for the massive spending on infrastructure which Alphabet and Meta did not provide.
Microsoft Azure was reported to grow 43% which was the most important number in the report. Management guided growth in the 39% to 40% range, so this was a significant increase over the expected growth. This also meant that Microsoft Azure growth had not decelerated from the previous quarter, but had actually accelerated, which was counter to investor concern.
AI services were estimated to account for 16% of that growth of Azure in Q3 and were expected to accelerate that growth in Q4 even further. This, combined with the 84% growth in Microsoft’s $678 billion commercial RPO (contracted future revenue), demonstrates that the significant investments on infrastructure were being built to support existing contractual customer demand.
Copilot and GitHub: The AI Monetisation Evidence
Microsoft 365 Copilot expanded from 20 million paid commercial seats in Q3 to 30 million, a 50% expansion in a quarter. This count captures the AI monetization evidence the market anticipated following Copilot’s commercial launch in the fall of 2023. At the approximate enterprise customer, per-seat price of $30, 30 million seats translates into a near $10 billion annual revenue run rate for a product that originated 18 months ago.
GitHub Copilot’s 50 million users demonstrates the developer productivity use case is growing even more rapidly than enterprise productivity. These metrics do not represent interest in a product, as they also do for other companies - they represent a strong, recurring subscription revenue stream.
Microsoft’s AI annual revenue run rate in Q3 FY2026 was $37 billion, a growth of 123% year-on year. Q4 Copilot seat and AI related Azure revenue run rate estimates indicate further acceleration, though Q4 AI revenues were not made clear in the available reports. In a year-on-year context: for fiscal year 2026, total Microsoft Cloud revenue grew to over $214 billion, an increase of 27%.
Microsoft Azure crossed the $100 billion mark in annual revenue, an increase of 41% year on year. Microsoft's AI and Cloud businesses are experiencing paradigm shifts in revenue, rather than incremental growth.
MSFT Technical Setup After the 8% Move
Microsoft was trading at $390.54 before the earnings announcement, and after the announcement the stock was trading at $422.30 in after hours. The post earnings stock price is above the 200-Day Exponential Moving Average (EMA) for the first time since the May/June sell-off. The Relative Strength Index (RSI) was neutral (near 50) prior to earnings. An 8% shift after hours will mean that on Thursday the stock will be trading in the $421.60 to $446.10 resistance range.
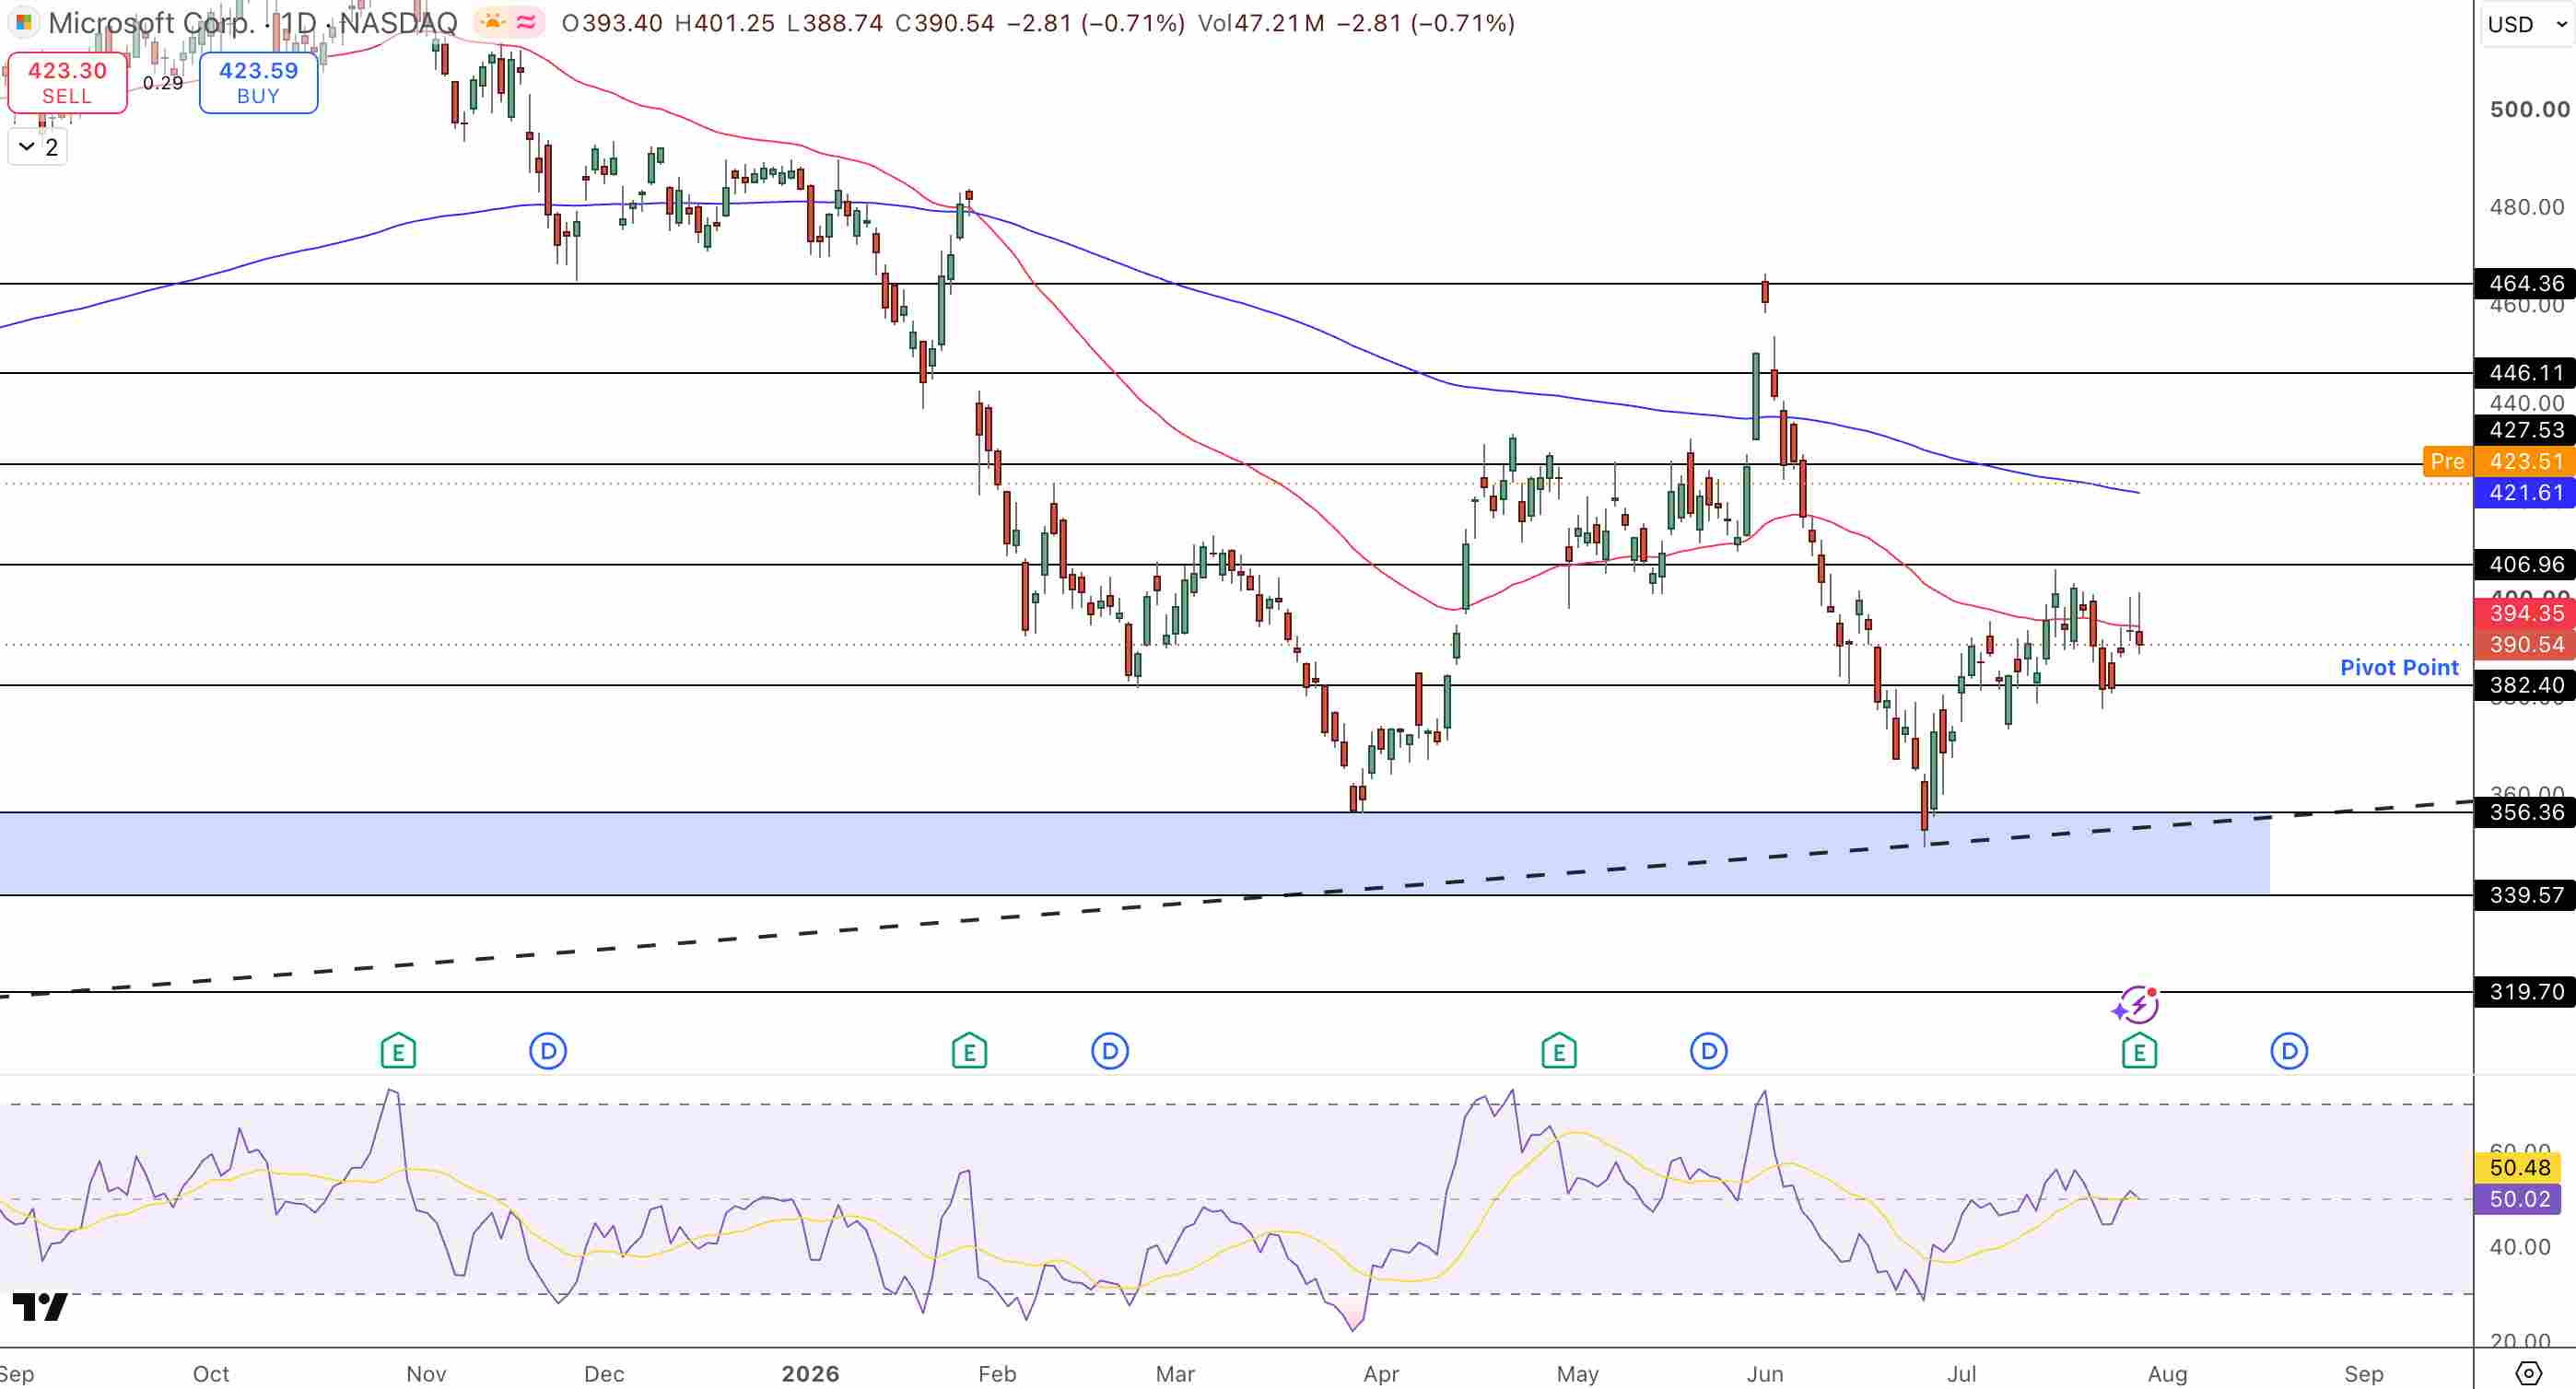
Microsoft (MSFT) Price Chart - Source: Tradingview
The stock price was previously trading at $406.90 before the earnings announcement and that price level is now the first support level if the stock price falls. In the absence of the after-hours shift, Thursday's price action will confirm that the 200-Day EMA (previously at $421.60) was the most significant hurdle for the stock.
Key Levels
- After-hours: +8.13% to $422.30 from $390.54 close. 52-week range: $349.20 to $555.45
- Q4 revenue: $90.01B vs $87.62B est (+2.7% beat). +18% YoY. Non-GAAP EPS $4.74 vs $4.33
- Azure: +43% (vs 39-40% guidance). First year crossing $100B annual revenue (+41% FY)
- Copilot: 30M paid commercial seats (from 20M in Q3). 50M users of GitHub Copilot
- Commercial RPO: $678B (+84% YoY). Contracted future revenue indicates strong demand-driven capex
- Capex: Q4 $41B. Full year $115.95B. NOT raised for FY2027 - significant differentiator vs Alphabet/Meta
- FY2027 guidance: Confirmed double-digit revenue and operating income growth
- 200-day EMA: ~$421.60 - cleared in after-hours. Resistance currently $446.10
Why Did Microsoft Surge While Meta and Alphabet Both Fell After Their Reports?
All three hyperscalers reported strong revenue growth in the same week. Alphabet reported revenue figures 4.8% above consensus estimate and fell 15%. Meta beat consensus by 1% and fell 9.64% after hours. Microsoft reported 2.7% above consensus and rose 8.13%. The major differentiator was capex shaping and guidance. Alphabet increased annual capex guidance to $195 to $205 billion and provided no clear evidence of demand to contractually back the capex.
Meta increased capex to $130 to $145 billion and posted only $784 million of free cash flow. Microsoft held capex framework and stated demand for Azure exceeds current supply and provided guidance for double-digit growth in revenue and operating income for FY2027. The market focused on Microsoft stating that AI Infrastructure investments were demand driven and therefore NOT speculative, and the market reacted positively.
What Does Copilot at 30 Million Seats Mean for Revenue?
Enterprise clients pay around $30 per month for each user for Microsoft 365 Copilot. With 30 million paid seats, Copilot is projected to have an annual revenue run-rate of about $10.8 billion. Just 1.5 years ago, Microsoft 365 Copilot did not generate significant revenue.
From Q3 to Q4 FY2026, Microsoft saw its steepest quarter-on-quarter revenue growth with a 50% jump in paid enterprise clients to 30 million. GitHub Copilot has 50 million users. Microsoft has proved that AI features are a paid revenue generating focus. This growth is crucial to Microsoft’s $41 billion quarterly capital investment for infrastructure.
Bottom Line
Microsoft’s Q4 FY2026 revenue was reported at $90.01 billion, 2.7% higher than estimates. Azure revenue grew 43% from the prior year, exceeding the 39% to 40% targets. Copilot had 30 million paid users. Microsoft's stock rose 8.13% to $422.30 in after-hours trading. The length between Microsoft and Alphabet's and Meta's revenue overperformance was not in the magnitude the overperformance was, but in the narrative for capital investments.
Microsoft decreased, rather than increased expected capital expenditures and provided a statement of the investments being demand driven from the $678 billion commercial RPO. FY2027 estimates Double-digit growth for revenue and operating income indicates that the recovery forecast for FY2026 is confirmed. Thursday's trading opened at $422.30 confirming the trend reversal.
Recommended Articles


