


Nvidia Stock Price Forecast: Will Shares Rise After 5% Slump Following $500 Billion SK Group Deal?
TradingKey - On July 27, Eastern Time, Nvidia ( NVDA) fell more than 5%, marking its largest drop since February 2026. The stock price took a hit, breaking below multiple moving averages from the 5-day to the 120-day, hitting a low of $195.44.
Reportedly, Nvidia and South Korea's SK Group announced an AI cooperation agreement worth over $500 billion last Friday evening. Meanwhile, it is in talks with OpenAI regarding a guarantee agreement of up to $250 billion to assist the latter in leasing a data center project developed by a SoftBank subsidiary in Ohio.
The market is concerned that this business model could distort Nvidia's operational decisions and create adverse incentives. Once demand in the AI industry falls short of expectations, the risk of losses along the industry chain will be further amplified. Reportedly, most of the companies Nvidia invests in or holds stakes in are core buyers of its own chips.
Gary Tan, portfolio manager at Allspring Global Investments, stated, "While Nvidia's investments and partnerships reinforce market confidence in the long-term buildout of AI, investor concerns over round-tripping finance remain. Capital is increasingly being used to support future AI customers and infrastructure deployment."
Meanwhile, investor concerns over Nvidia's potential financial commitments have intensified, with the company's credit default swap (CDS) prices posting their largest single-day gain on record on Monday.
According to ICE Data Services, Nvidia's five-year credit default swap price rose by about 0.14 percentage points on Monday to approximately 0.82%, marking its largest intraday gain since active trading of the contract began last November. This implies that the cost for investors to hedge against the risk of Nvidia's debt default has risen significantly.
Market analysis suggests that as investment in AI infrastructure continues to expand, the market is beginning to focus on Nvidia's potential assumption of more financing and guarantee obligations, which is also a key driver behind the sharp rise in the company's CDS prices. While a rising CDS does not imply that the market expects the company to default, it reflects that investors are demanding higher risk compensation for its potential financial risks.
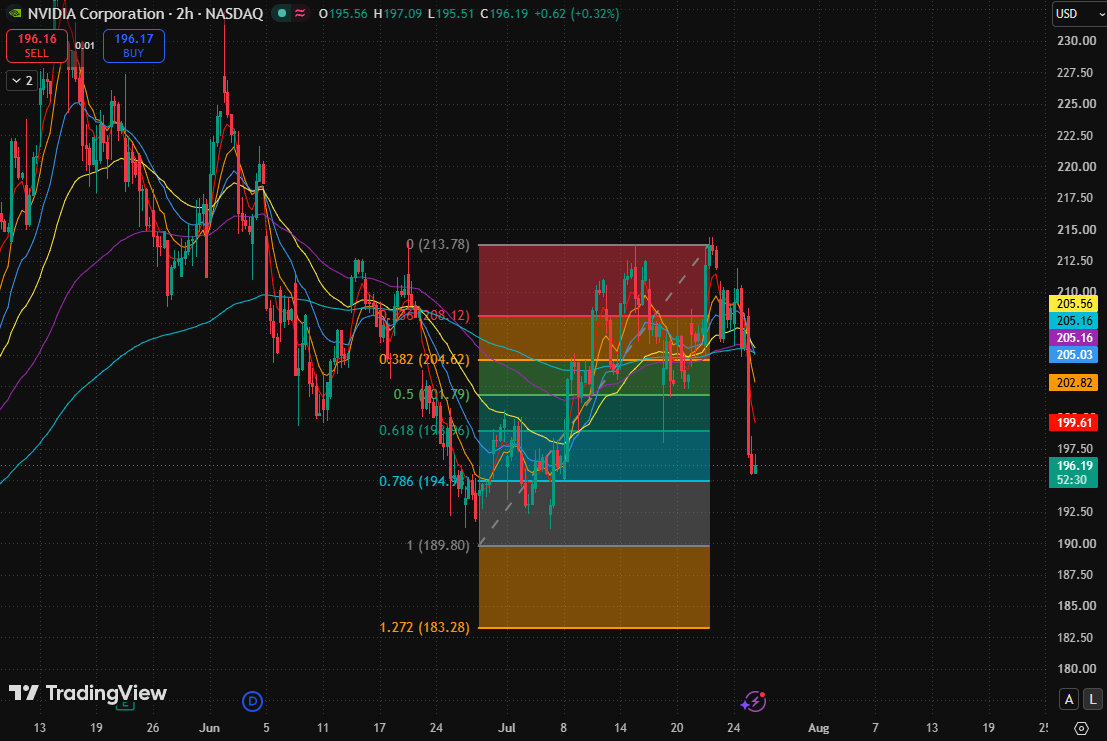
Nvidia 2-hour stock chart, Source: TradingView
Looking at Nvidia's stock chart, after hitting an all-time high in mid-May ($236), the stock entered a medium-term correction. The decline accelerated in June, and it touched a local low of $189.80 in early July, with a cumulative drawdown of about 13.5%. It then initiated a rebound, touching a local high near $214 on July 22, representing a rebound of approximately 10%.
Overall, Nvidia currently remains in a state of 'pullback confirmation after a rebound.' The current price sits in a dense cluster of key technical levels, breaking below the Fibonacci 0.618 level ($198.96) intraday, but remaining above the Fibonacci 0.786 level ($194.93), indicating a massive divergence between bulls and bears.
However, all current moving averages are currently situated above the stock price, representing a classic bearish alignment, with the overall moving average structure exhibiting a weak pattern of 'dense downward resistance'.
If it fails to hold firm at the multiple support levels around $194, the downside room will open toward the local low ($189.80), which is only 3% away from the current price. Once broken, it would mean that the rebound starting from late June has completely failed, and the Fibonacci 1.272 extension level ($183.11) will become the next target.
On the upside, if it holds firm above the Fibonacci 0.786 level ($194.93), it is expected to further challenge the key range of $200-$205 (the Fibonacci 0.5 level + dense moving average zone). Before that, however, bulls and bears will wage an intense battle around the round number of $200.
Recommended Articles


