


JPMorgan (JPM) Q2 2026 Earnings Preview: $5.59 EPS Consensus, $103B NII Guidance, and the $338.45 Trigger
TradingKey - JPMorgan Chase (NYSE: JPM) kicks off its Q2 2026 earnings on July 14, 2026, reporting ahead of the open at 7 a.m. ET and hosting its earnings call at 8:30 a.m. ET. The consensus estimate before earnings release is EPS of $5.50 to $5.59, with revenue of $49.16 billion to $51.09 billion, representing a 12% to 13% increase from Q2 2025. JPM has beaten estimates in four of the last five earnings reports, the last of which came in Q1 2026 when the company posted EPS of $5.94, compared to a consensus of $5.50, on revenue of $50.54 billion (+10% YoY).
The most important number for analysts to focus on is net interest income: Management guidance is $103B for full year 2026, or $95B ex markets; Q1 2026 net interest income was $25.4B, and Q1’s $25.4 billion run rate must hold for the annual target to remain achievable. JPM at $334.62 sits above the trendline support at $332.72 and has a RSI of nearly 46 (neutral). The breakout trigger sits at $338.45.
Q2 Consensus: EPS and Revenue; What to Focus on in NII, Capital Markets, and the Basel III Variable
The consensus estimate for Q2 2026 is $5.50-$5.59 per share, compared to Q2 2025's Q2 2025 at $4.96-$5.24. This represents a 8% to 13% YoY growth, which would still be healthy growth but is a sequential decrease compared to Q1 2026's $5.94 EPS.
The decrease makes sense: the first reason is seasonal, as Q1 has historically seen front-loading of deal flow from a back of M&A opportunities that built up after the rate cut in January 2026; and Q2 won't be able to replicate 2026's Q1 growth of 20% YoY in Sales and Trading revenues of $11.6B and investment banking fees of $2.9B up 28% YoY, as markets will have less volatility in Q2 2026.
The most important number to focus on is NII, Q1 NII of $25.4B put JPM in line with the guidance of $103B for 2026 full-year. If JPM has a Q2 at or above $25B, the full year 2026 target is intact, so the forward valuation of the stock remains intact. If JPM has less than $24.5B, then investors will need to ask if they can meet the target.
Another important area to watch, is JPM's first Basel III disclosure for G-SIBs surcharge in Q1 2026. Management has set a G-SIB surcharge target of 5.2% of 2028, versus 4.5% today. This would mean an additional $20B of capital requirement, thus limiting buyback capacity of the stock, which is why the stock is up only 4% YTD despite the Q1 earnings record, in the Q2 earnings management will be first addressing whether Basel III end-game proposed rules released since Q1 have changed this capital planning and if any extra cushion of capital has been taken into account when they set H2 2026 capital return guidance.
The Crypto Portfolio, Kinexys Blockchain, and What the $103B NII Commitment Means
Another important thing to keep an eye on in the JPM earnings call will be their portfolio of Bitcoin and Kinexys blockchain. The first factor is that JPM has increased its BlackRock IBIT holdings by 175% to 8.3 million shares of the Bitcoin Spot ETF.
For the first time, a US largest bank by asset size has taken such a position in a crypto asset, and is now allowing other mid-tier asset managers, consultants, and pension funds to follow with the precedent of their balance sheet. JPM has also filed to launch tokenized money market funds on Ethereum via its Kinexys platform, with major corporate users like Mitsubishi Corporation, and FirstRand Bank, to mention a few, being already onboard.
In Q2, JPM has a chance to give investors an exact figure on how much Kinexys is contributing to revenues, and an exact amount of unrealized gains/losses on the BlackRock IBIT, since we know the price of BTC on the day that they filed for the ETF in Q2, this is a real P&L for JPM.
The other more relevant factor, to investors not focused on crypto assets, is their NII of $103B full-year guidance, which was set back in January 2026, when the rate environment still looked to have the Fed higher for longer through Q2/Q3 2026. So if the CPI numbers released this morning indicate the rate cuts are accelerating, then the NII guidance could be lowered, as deposits will be losing spread.
There is also the risk that JPM's full-year NII guidance of $103B may be revised downwards if they feel like rates will be lower in 2H26. In fact, the option market is pricing in a 4.4% move, up or down, post-earnings (above the stock’s historical average 2% post-earnings move), indicating a directional uncertainty among traders, which is quite unusual for a bank that produces as predictable earnings results as JPM.
JPM Technical Setup — Trendline at $332.72, RSI 46, Trigger $338.45
JPM at $334.62 is holding trendline support of the 2H rising trendline of $332.72 after the pull-back from its $341.78 high. With a RSI at 46 (neutral), the RSI has room to recover.
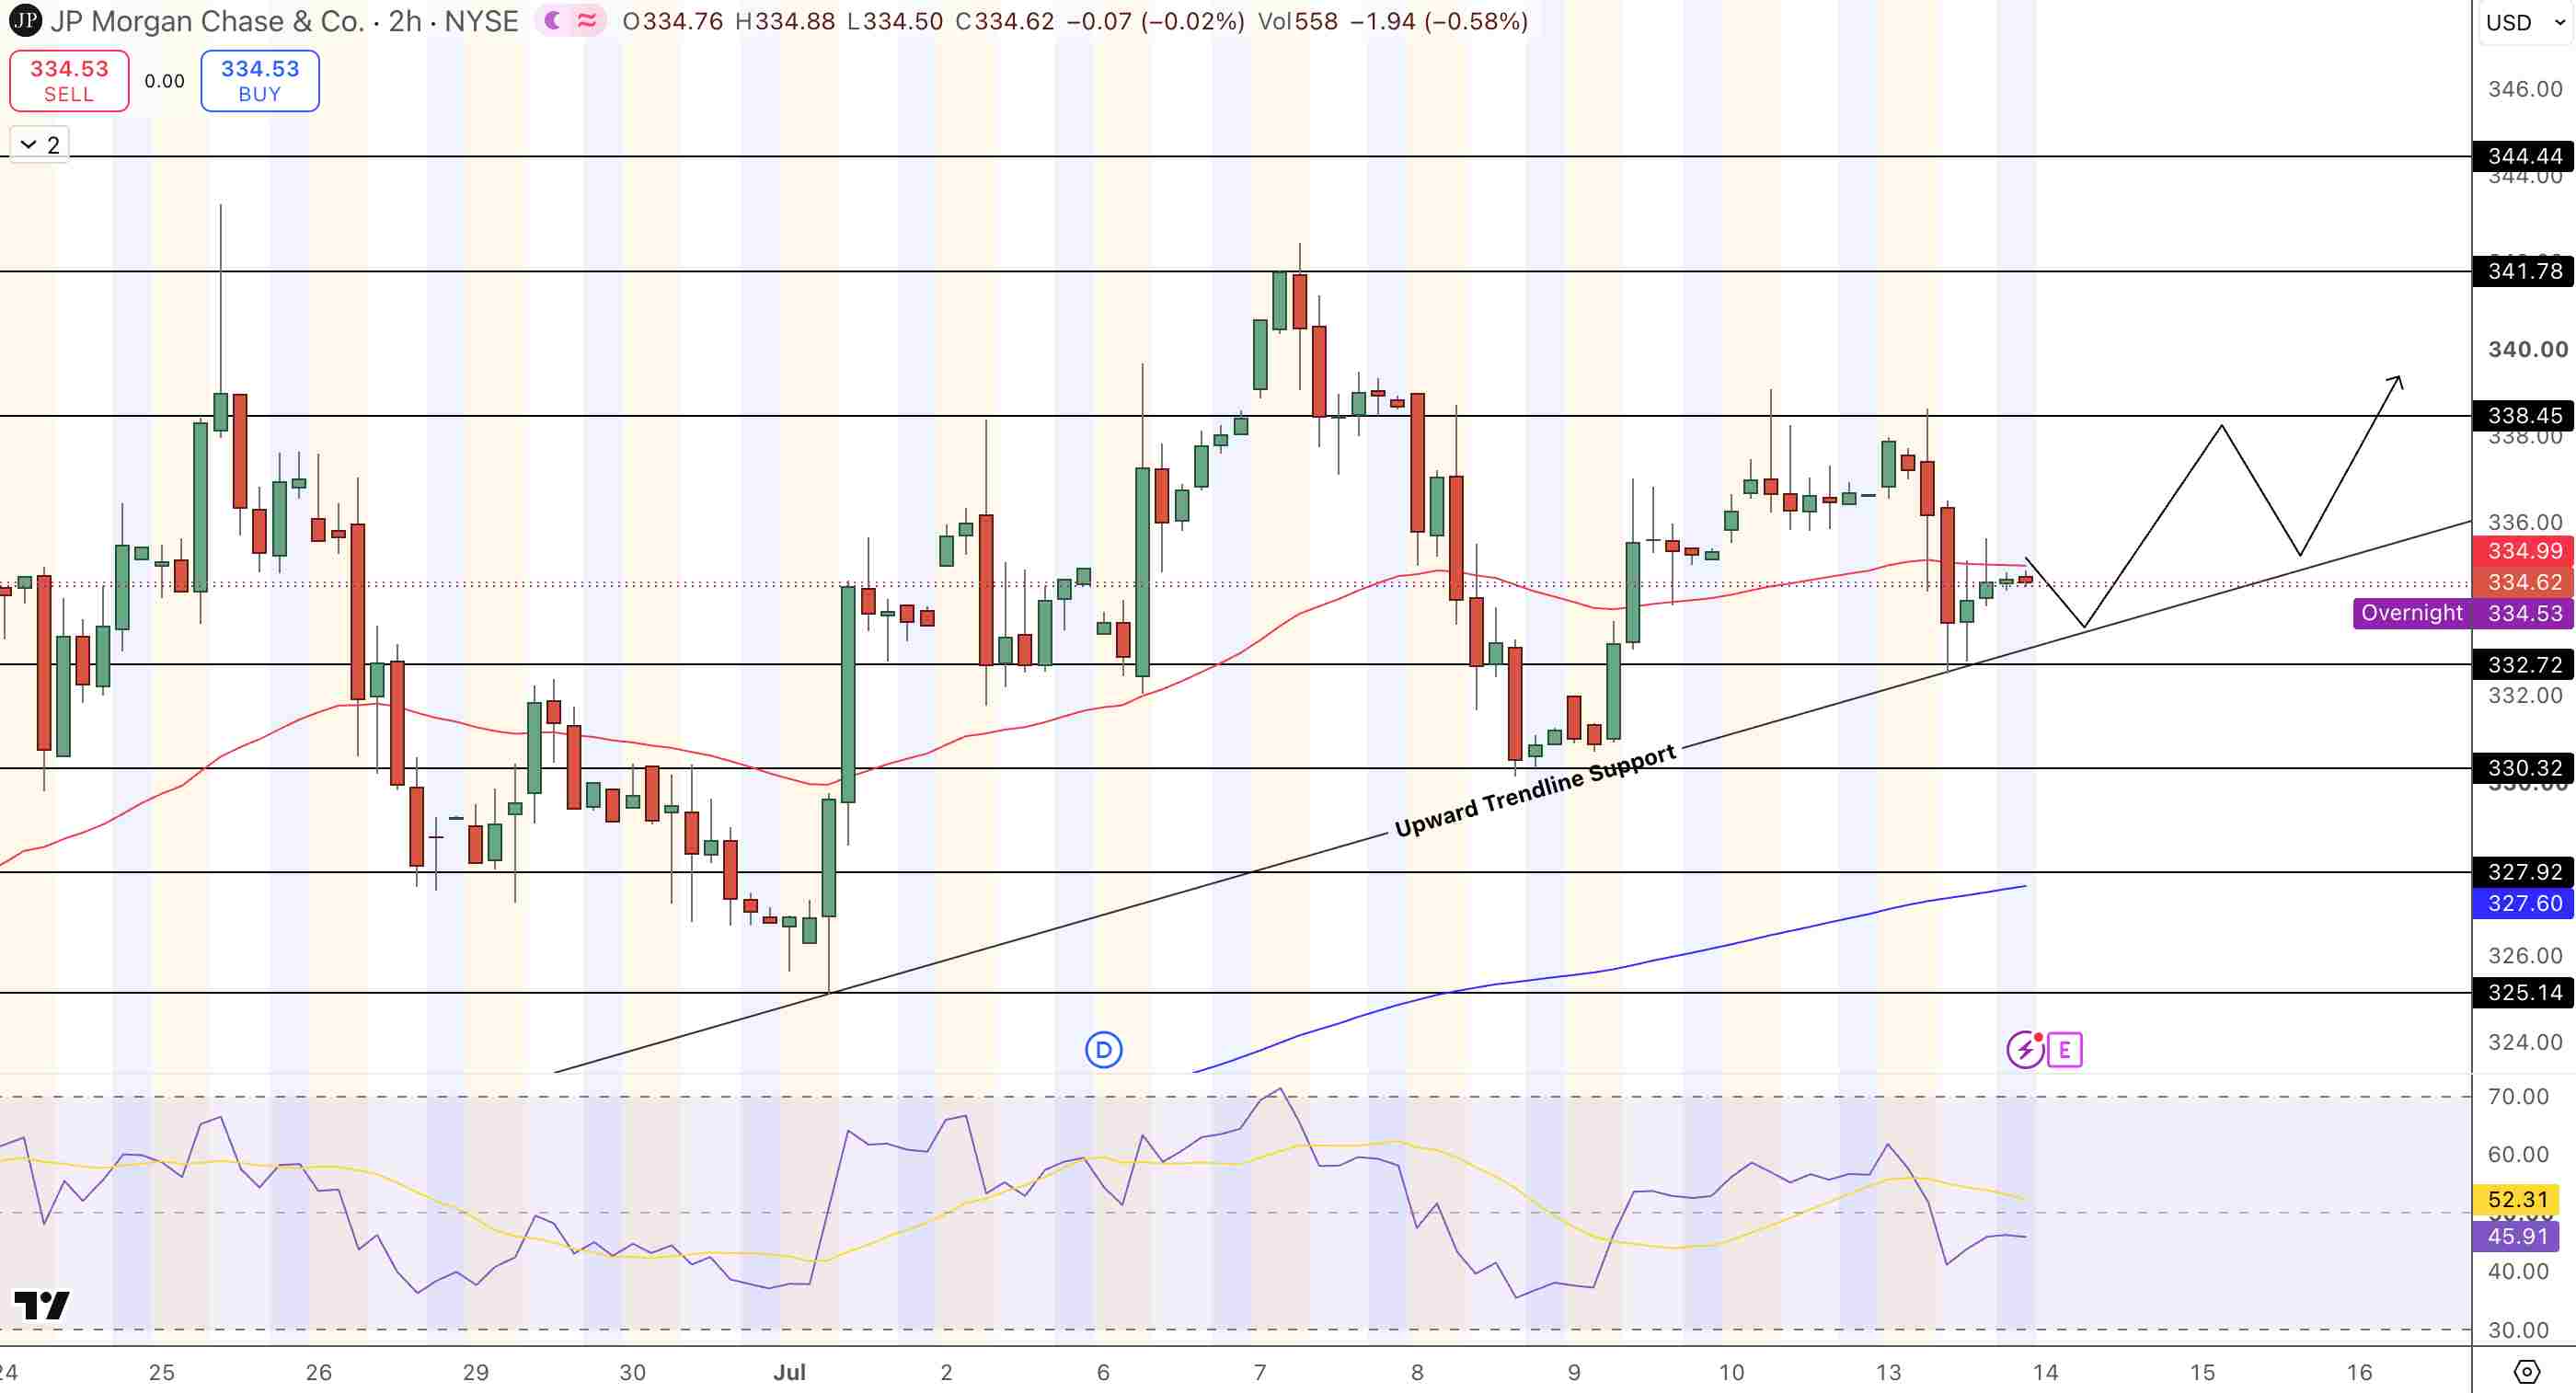
JPMorgan (JPM) Price Chart - Source: Tradingview
A close above $338.45, triggers a move towards $341.78 and then $344.44, while a break below $332.72 opens up a move towards $330.32, where 200 EMA (exponential moving average) is at $327.60.
- Bull trigger: $338.45, with a next move towards $341.78 and then $344.44
- Bear trigger: Close below $332.72 opens $330.32 to $200 EMA $327.60
- Q2 Consensus: EPS $5.50 to $5.59, or +8% to 13% YoY. Revenue of $49.16B to $51.09B
- NII Watch: 103B FY target. $25.4B Q1. If Q2 is ~$25B, full-year is in.
- Basel III Capital Risk: $20B more capital needed as of 2028, with 5.2% G-SIB surcharge (up from 4.5%)
- Implied move: Option pricing 4.4% either way post earnings, which is higher than its historical average 2% post-earnings move
What Is JPMorgan Expected to Report for Q2 2026?
Going into the July 14 Q2 '26 print, the Street's median expectation has JPM delivering EPS of $5.50-$5.59, up roughly 8%-13% y-o-y versus Q2 '25's $4.96-$5.24 spread. On revenue, consensus is $49.16B-$51.09B. JPM has come in ahead of EPS projections in four of its past five quarters, most recently delivering Q1 '26 EPS of $5.94 vs. the $5.50 call on revenue of $50.54B. The headline metric for traders will be JPM's $103B full-year NII projection, and JPM's progress towards hitting that number.
Why Is Net Interest Income the Key Variable at JPMorgan’s Q2 Earnings?
Net interest income (NII) is the difference between the spread JPM can charge on loans and investments vs. what it can pay its depositors in interest. JPM management guided the bank to deliver $103B of full-year 2026 NII ($95B excluding markets). In Q1 '26, the bank booked $25.4B of NII, on target to meet management's forecast. So long as Q2 NII comes in at or above $25B, JPM should be fine on that front.
If, however, Q2 NII comes in under $24.5B, the Street will begin to rework its full-year outlook, and the risk will become apparent that JPM won't be able to hit the target it set for itself this year. That outcome, in turn, would drag on shares and cast doubt on JPM's H2 2026 projections. June CPI data released simultaneously adds further rate-trajectory uncertainty.
What Is the Basel III G-SIB Headwind JPMorgan Has Disclosed?
The bank is disclosing in Q1 2026 that its new G-SIB (global systemically important bank) capital requirement will be 5.2% by 2028, from the existing 4.5%. That is an approximately $20B hit to JPM's ability to repurchase shares and pay dividends, which is why JPM is only up ~4% YTD this year despite beating earnings in Q1 '26. Expectations are that JPM will address its Basel III planning outlook for the first time on the Q2 conference call, specifically given the proposals the regulators released since JPM issued its Q1 guidance.
Bottom Line
JPMorgan will report Q2 2026 earnings at 7:00 a.m. ET today to an EPS consensus of $5.50-$5.59 and revenue of $49.16B-$51.09B. $103B full-year NII and JPM's ability to produce the $25B run rate are the two primary things that will matter. JPM has come in front in four of its last five quarters; options are pricing a 4.4% move either direction, above the historical average.
The Basel III G-SIB capital headwind and the bitcoin ETF and Kinexys blockchain disclosures represent secondary threads in today's narrative. JPM is trading at $334.62 above trendline support. $338.45 would trigger a move higher toward $341.78 and $344.44; a breakdown below $332.72 would open the way to $330.32 and $327.60.
Recommended Articles


