


The Stock Market Is Flashing a Warning Signal Seen Only Once Before. Here's What History Says Comes Next.
Key Points
The stock market has been soaring, but many investors are on edge right now.
The S&P 500's valuation is reaching record territory, which can be risky in some ways.
Investing in the right places can set you up for long-term success.
- 10 stocks we like better than S&P 500 Index ›
This year has been an interesting one for the stock market, to put it mildly. Major indexes just ended their best quarter in years, with the S&P 500 (SNPINDEX: ^GSPC), Nasdaq Composite (NASDAQINDEX: ^IXIC), and Dow Jones Industrial Average (DJINDICES: ^DJI) up by 14%, 19%, and 13%, respectively, since early April.
At the same time, though, investors are growing pessimistic about the market's future. While around 31% of investors believe stock prices will rise in the next six months, according to a survey from the American Association of Individual Investors published on July 1, 42% believe the market will fall.
Missed Nvidia in 2009? This Rare Signal Is Flashing Again. In 2009, a "Double Down" signal flashed for a little-known chipmaker called Nvidia. For the first time in years, that same "Total Conviction" signal is flashing for a company 1/100th the size of Nvidia. Continue »
The market's short-term future will always be uncertain, but there's one indicator creeping into territory seen only during the dot-com bubble of the early 2000s. Here's what history says might be coming.

Image source: Getty Images.
Stocks are reaching record valuations
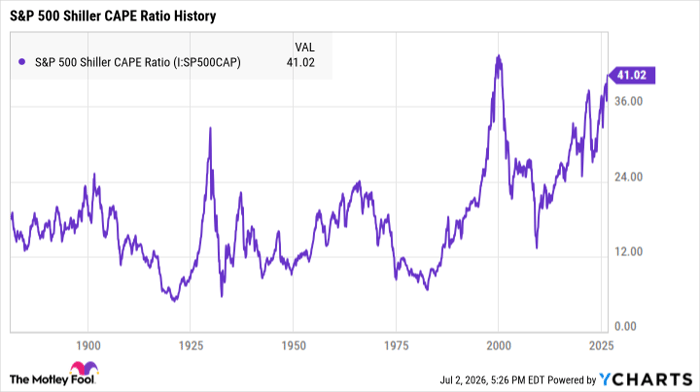
The S&P 500 Shiller cyclically adjusted price-to-earnings (CAPE) ratio gauges the S&P 500's valuation over time by tracking the index's 10-year inflation-adjusted earnings.
Higher metrics suggest the market is trading at a premium relative to previous market cycles, and historically, stock prices tend to fall in the years after the ratio peaks.
Its long-term average is around 17, and it's extremely rare for this metric to surpass 40 for an extended period. In fact, the only time in history that happened was during the dot-com bubble, when it stayed above 40 consistently from January 1999 to September 2000. For reference, the dot-com bear market officially began in March 2000.
S&P 500 Shiller CAPE Ratio data by YCharts
More recently, this ratio has been hovering near 40 for close to a year. But it's consistently stayed above 40 since May 2026 and is now sitting at just over 41.
To be clear, this doesn't mean that the market is headed toward a bubble similar to the dot-com collapse. But it's rare for the S&P 500 to be this richly valued, and investors would be wise to exercise caution in where they choose to invest right now.
What history says is coming
If history shows us anything, it's that healthy companies are incredibly resilient over time. So the best thing investors can do now is invest in quality stocks and prepare to hold them for at least a few years -- if not decades.
Plenty of stocks are overvalued right now, and these investments have the most to lose during a downturn. While some stocks may appear successful with soaring prices, if those prices aren't justified by strong business fundamentals, they may face a severe pullback when the market turns.
^SPX data by YCharts
However, there's also no shortage of undervalued stocks with loads of growth potential. These companies may still face short-term volatility, but with strong foundations, they're more likely to recover with enough time.
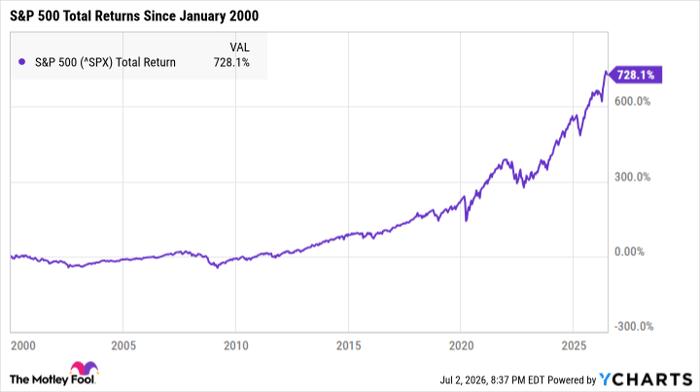
Since January 2000, the S&P 500 has earned total returns of more than 728% -- which would have turned a $10,000 investment into roughly $82,000 by today with zero additional contributions. While some companies will struggle to survive a bear market or recession, strong organizations will fuel market gains for decades to come.
Should you buy stock in S&P 500 Index right now?
Before you buy stock in S&P 500 Index, consider this:
The Motley Fool Stock Advisor analyst team just identified what they believe are the 10 best stocks for investors to buy now… and S&P 500 Index wasn’t one of them. The 10 stocks that made the cut could produce monster returns in the coming years.
Consider when Netflix made this list on December 17, 2004... if you invested $1,000 at the time of our recommendation, you’d have $418,761!* Or when Nvidia made this list on April 15, 2005... if you invested $1,000 at the time of our recommendation, you’d have $1,195,804!*
Now, it’s worth noting Stock Advisor’s total average return is 918% — a market-crushing outperformance compared to 208% for the S&P 500. Don't miss the latest top 10 list, available with Stock Advisor, and join an investing community built by individual investors for individual investors.
See the 10 stocks »
*Stock Advisor returns as of July 6, 2026.
Katie Brockman has no position in any of the stocks mentioned. The Motley Fool has no position in any of the stocks mentioned. The Motley Fool has a disclosure policy.
Recommended Articles


