

Gold Was Volatile in the First Half of 2026. Here's How to Invest in Gold for the Rest of the Year.
Key Points
Central bank buying is a key long-term driver of gold demand.
It's also a key supporting argument for buying the precious metal.
Any significant price weakness provides an opportunity for investors.
- 10 stocks we like better than Newmont ›
Gold went through a volatile period in the first half of the year, with a spike in late January followed by a sharp decline to below $4,100 at the time of writing. It represents a mid-single-digit decline on the year. Still, the price is up almost 25% year over year, and many of the fundamental factors driving the gold price remain in place.
So what happened in the first half of 2026, and what can we expect for the rest of the year?
Where to invest $1,000 right now? Our analyst team just revealed what they believe are the 10 best stocks to buy right now, when you join Stock Advisor. See the stocks »
Gold's volatile 2026
I'll cut straight to the chase. The correction in the price of gold in 2026 (see chart below) is due to a natural correction in speculators' overinvestment. Still, the fundamental underlying demand driver of central bank buying remains in place. In addition, the price reduction should induce price-sensitive demand (jewelry) to come in and support the market.
As such, the correct strategy is to be mindful of the potential for further declines, but to have a bias toward buying into any significant market-led weakness in gold, a gold ETF, or a gold miner such as Newmont (NYSE: NEM).
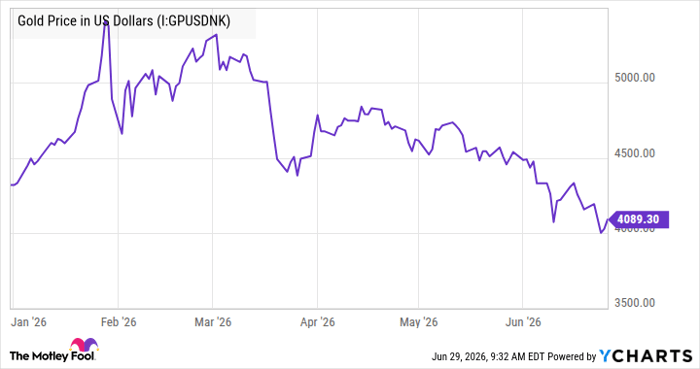
Gold Price in U.S. Dollars data by YCharts
It's easy to write this, but it needs to be backed up with a reasoned argument and facts, so here goes.
Overinvestment in gold?
Let's start by looking at the components of gold demand in the first quarter of 2026. The key things to look out for here are the importance of investment demand (bars, coins, and exchange-traded funds, or ETFs) to overall marginal demand for gold.

Data source: World Gold Council. Chart by the author.
Technology demand tends to be relatively stable, while central bank purchases appear to be in a long-term structural uptrend (more on that in a moment). Jewelry demand tends to be price-sensitive, so the sharp price increase through 2025 likely curtailed demand in the jewelry sector.
All of these impacts are evident in the evolution of gold demand from 2024 to 2025, with surging investment demand driving a 65% increase in gold prices. As such, going into 2025, a large increase in investment demand (see table below) more than offsets declines in jewelry and central bank demand, possibly in response to higher prices.
Whenever investment demand increases by such an amount, it's likely to create a situation in which some weak gold holders could easily liquidate their positions given any volatility in gold prices.
|
Gold Demand (Metric Tons) |
2024 |
2025 |
Change in Demand in 2025 |
|---|---|---|---|
|
Technology |
326 |
323 |
(3) |
|
Jewelry |
2,027 |
1,638 |
(389) |
|
Total Bar and Coin |
1,188 |
1,374 |
186 |
|
ETFs & Similar Products |
(3) |
801 |
804 |
|
Central Banks |
1,092 |
863 |
(229) |
|
Total |
4,631 |
4,999 |
369 |
Data source: World Gold Council. Any discrepancies are due to rounding.
Central bank buying
Indeed, the process of investors liquidating positions appears to have started in the first quarter with a decrease in ETF demand of 65 metric tons from the end of 2025. However, net central bank demand improved in the first quarter, and as JPMorgan Chase argues, China appears to be ramping up gold purchases.
Ongoing central bank buying, as part of a long-term structural trend, is the key assumption made by gold bulls. It's based on the belief that the seemingly inexorable increase in U.S. debt levels will encourage central banks to diversify their reserve holdings away from U.S. debt toward buying more gold. In addition, ongoing geopolitical and trade tensions are encouraging foreign governments to move away from U.S. dollar assets that could be subject to sanctions.

Image source: Getty Images.
The outlook for 2026
Putting it all together, the bullish view is that central bank purchasing will likely continue its long-term upward trend. At the same time, any price weakness will encourage jewelry demand and, at some point, many of the speculative weak holders in gold will have liquidated their positions.
All of which suggests that, while there's obviously still near-term downside risk, the long-term trend is upwards, and investors should buy into any pronounced weakness.
Should you buy stock in Newmont right now?
Before you buy stock in Newmont, consider this:
The Motley Fool Stock Advisor analyst team just identified what they believe are the 10 best stocks for investors to buy now… and Newmont wasn’t one of them. The 10 stocks that made the cut could produce monster returns in the coming years.
Consider when Netflix made this list on December 17, 2004... if you invested $1,000 at the time of our recommendation, you’d have $418,761!* Or when Nvidia made this list on April 15, 2005... if you invested $1,000 at the time of our recommendation, you’d have $1,195,804!*
Now, it’s worth noting Stock Advisor’s total average return is 918% — a market-crushing outperformance compared to 208% for the S&P 500. Don't miss the latest top 10 list, available with Stock Advisor, and join an investing community built by individual investors for individual investors.
See the 10 stocks »
*Stock Advisor returns as of July 5, 2026.
JPMorgan Chase is an advertising partner of Motley Fool Money. Lee Samaha has no position in any of the stocks mentioned. The Motley Fool has positions in and recommends JPMorgan Chase. The Motley Fool has a disclosure policy.
Recommended Articles


