

Microsoft Stock Price Forecast: Over 20% Slump in First Half of 2026, Will It Keep Falling in the Second Half?
TradingKey - US stocks have officially closed the first half of 2026. After riding a collective rally in previous years, the Magnificent Seven tech giants saw a significant polarization in their performance during the first half of this year, with four gainers and three decliners, and Microsoft ( MSFT) was the worst-performing company among them. Entering the second half of 2026, will Microsoft's stock price continue to slide and test the $200 support level, or will it rebound and surge toward $460?
Historical Price Trend Review of Microsoft
Over the past half year, Microsoft's stock price underwent a "historic" correction. As of June 30, the stock price stood around $373, plunging nearly 23% from its early January peak of approximately $484. In just six months, Microsoft's stock experienced two sharp drops and one major rally, marking a highly volatile journey.
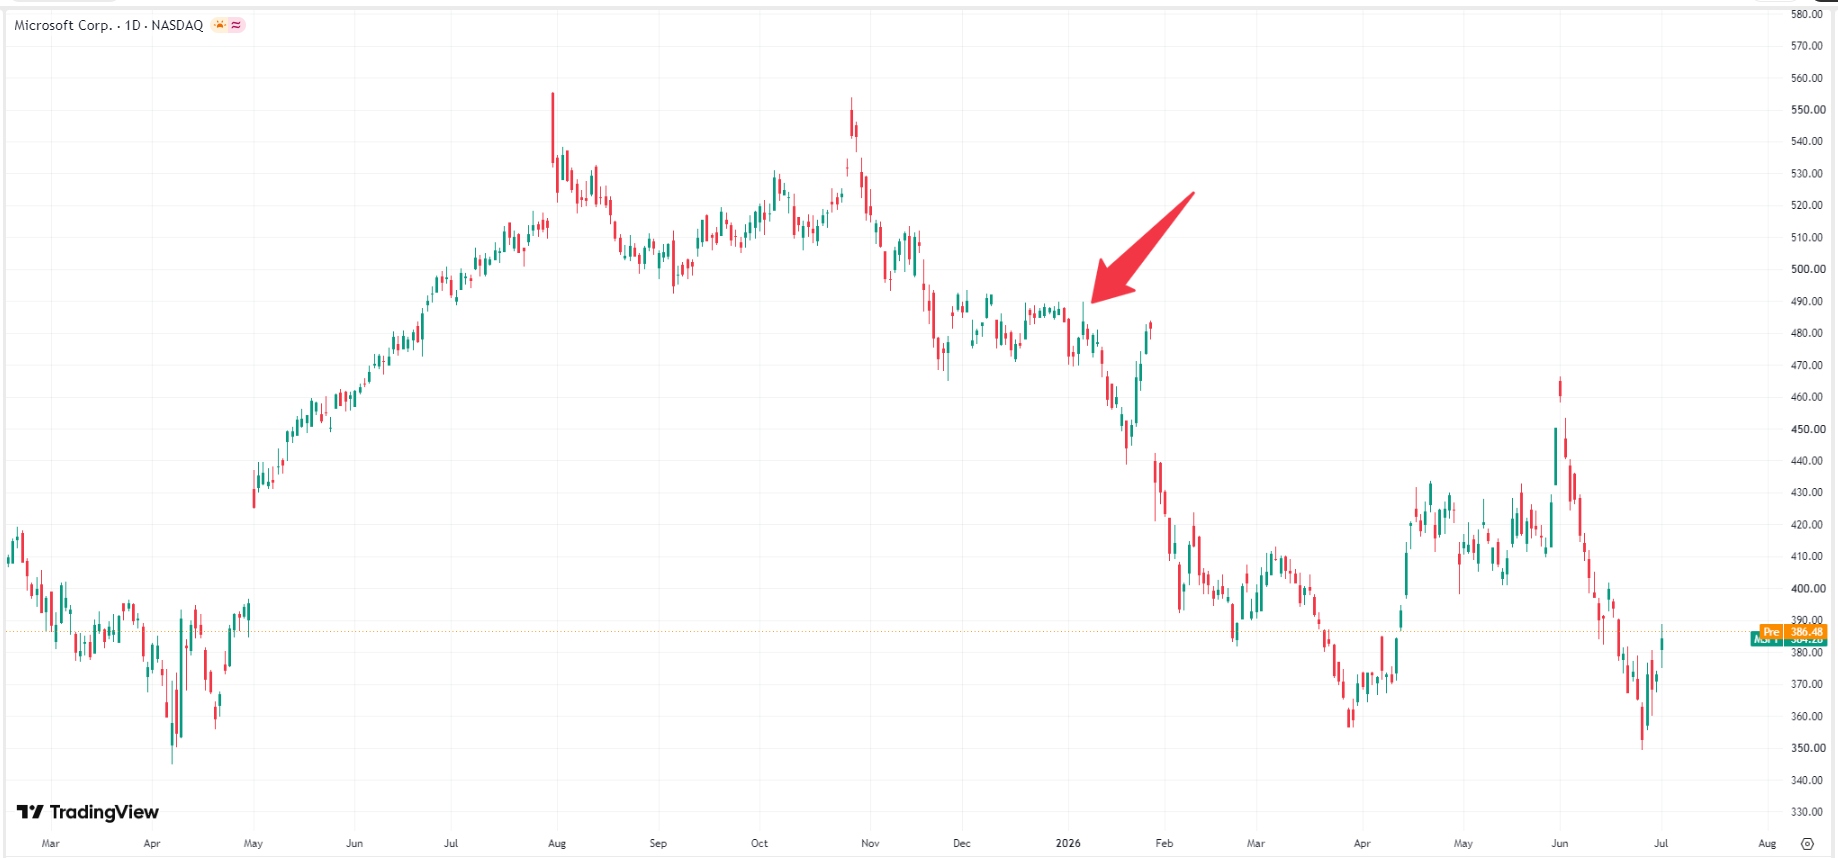 Microsoft Stock Price Chart, Source: TradingView
From January to March, Microsoft underwent a valuation correction and a deleveraging pullback. It drifted lower from $472 at the beginning of the year, lost the key psychological level of $400 in February, and accelerated its slide to a bottom of $358 in late March. From April to May, Microsoft's stock staged a notable V-shaped rebound. Starting around $370, it reclaimed the $420 level in mid-April. By late May, sustained support from its earnings report, AI infrastructure, and cloud business pushed the stock up again, closing at $450 on May 29.
In June, Microsoft's stock price primarily experienced a second bottoming out and a search for support. In early June, the stock briefly surged to $466, but quickly collapsed to hit its first-half low of $349 on June 25. During the final trading days of June, Microsoft showed strong dip-buying momentum, rallying consecutively to recoup some of its losses.
How is Microsoft performing among the Magnificent Seven?
Over the past six months, the three major U.S. stock indexes rose in tandem, but the performance of the 'Magnificent Seven' tech giants diverged. Among them, Alphabet performed the best, surging over 13%, while Microsoft performed the worst, plunging nearly 23%. The details are as follows:
Rank | Company (Ticker) | First-Half Performance (YTD) |
1 | Alphabet ( GOOG ) | +13.13% |
2 | NVIDIA ( NVDA ) | +7.00% |
3 | Amazon ( AMZN ) | +4.04% |
4 | Apple ( AAPL ) | +3.83% |
5 | Tesla ( TSLA ) | -6.00% |
6 | Meta ( META ) | -14.62% |
7 | Microsoft (MSFT) | -22.99% |
Why did Microsoft's stock price fall?
Before understanding why Microsoft's stock price fell, it is first necessary to know why its stock price had previously surged to record highs. From 2024 to 2025, Microsoft's stock price was pushed to historic highs by the AI halo. However, in the first half of this year, macro funds began rotating out of the AI bubble, and investors were no longer willing to pay a high premium for the "AI vision." This was mainly reflected in three areas: AI capital expenditures, the flagship AI product Copilot, and OpenAI.
In order to build AI data centers and purchase chips (GPUs/CPUs), Microsoft's capital expenditure has surged like a bottomless pit. Microsoft CFO Amy Hood significantly raised the capital expenditure guidance for the full year of 2026 to $190 billion, far exceeding the market expectation of $154.6 billion. Such huge upfront investment by Microsoft has led to a rare decline of over 20% in its recent free cash flow.
Although Microsoft has fully embedded Copilot into software like Office, its current market penetration and conversion rates have caused investors to lose patience. As of the middle of this year, among Microsoft's more than 450 million paid Microsoft 365 corporate seats, the paid penetration rate of Copilot was only about 3% to 4.4%. In addition, Copilot has been reported to have issues such as confused brand positioning and poor cross-platform compatibility. With Microsoft's exceptionally high investment in AI infrastructure, the resulting software monetization speed has been like "squeezing toothpaste," leading the market to believe that the return on investment of the $190 billion Capex cannot be proven in the short term.
What concerns the market even more is that Microsoft disclosed that as much as 45% (about $281 billion) of its whopping $625 billion in remaining commercial performance obligations is tied to a single customer, OpenAI, meaning that Microsoft's future revenue is highly dependent on OpenAI's survival. However, OpenAI itself is still in a highly cash-burning stage and has not yet achieved stable profitability. This "left hand to right hand" contract structure has prompted investors to start evaluating the structural risks.
Microsoft Stock Forecast: Will the Decline Continue into the Second Half of 2026?
Following the systematic deleveraging and repricing in the first half of the year, Microsoft's forward P/E ratio has been compressed from the previous frenetic 33–35 times down to around the current 21–22 times. This is well below its 5-year average of 30 times, and this valuation level has become highly attractive to long-term institutional capital. This suggests that the room for further declines in the second half of the year is relatively limited, with the stock expected to primarily fluctuate within a wide range of $350 to $460.
In the second half of the year, if the Federal Reserve initiates actual rate cuts before year-end, and if Microsoft's internal improvements—such as Azure's revenue growth rate remaining above 38% and Copilot's enterprise conversion rate exceeding expectations—materialize, it will help its stock price break through the upper resistance of the consolidation range and potentially challenge its historical high of $550. However, if Microsoft's AI monetization stalls significantly, particularly if the Federal Reserve raises interest rates, Microsoft might fail to hold even its key defensive line, heading toward the next critical support level of $200.
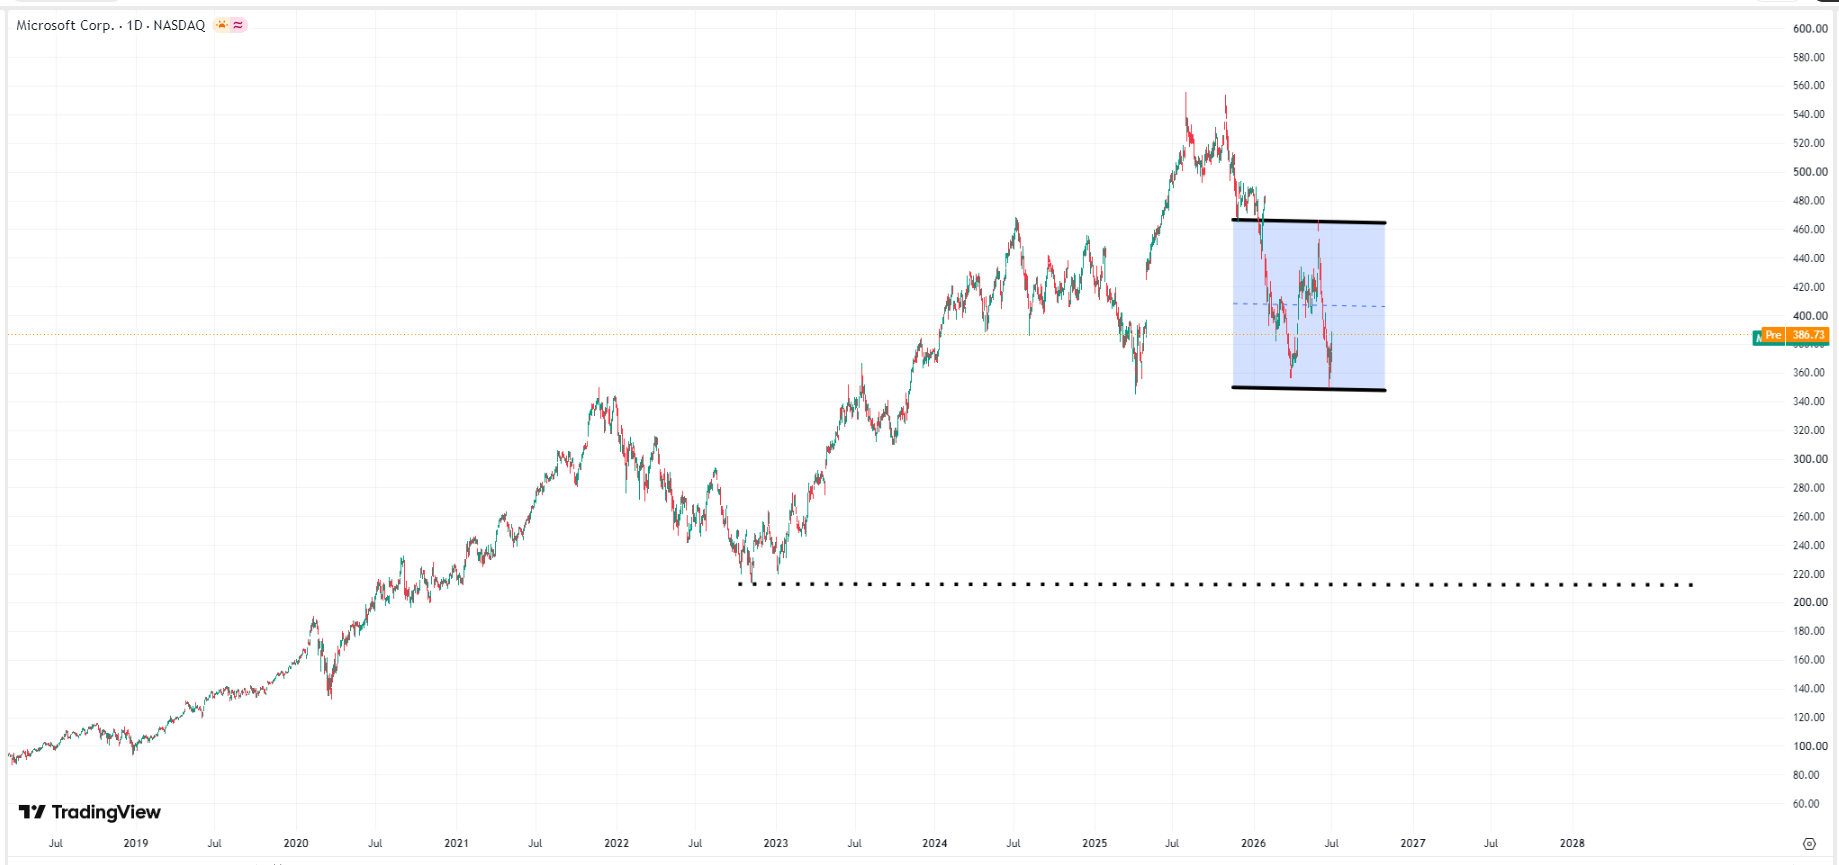 Microsoft stock chart, Source: TradingView
Recommended Articles


