

Toyota’s Tariffs Cost It ¥1.38 Trillion in FY2026 — Is TM Stock a Buy at $188?
TradingKey - Toyota FY2026 operating income ¥3.8T, net income -19% YoY. U.S. tariff hit ¥1.38T. FY2027 guided ¥3.0T. Dividend raised to ¥95. TM at $188, RSI 33, Fib supports $185.61. Target $198–$206.
Toyota Motor (NYSE: TM) dropped the FY 2026 results on May 8 - and let me tell you, it was a mixed bag. The company landed an operating income of 3.8 trillion yen - in line with what they've been telling us all along, but way down on last year's results - and a net income that plummeted 19% due to the impact of U.S tariffs alone stripping a whacking 1.38 trillion yen from the bottom line. They still managed to hit a record revenue of 50 trillion yen, largely thanks to the strength of their hybrid vehicles. But none of that can hide the fact that U.S. tariffs - and the strong yen - have really taken a toll on Toyota's profits.
FY2026 results - a record revenue but tariffs and the yen took the shine off profits
The good news is that revenue really held up okay. It was a record 50 trillion yen, driven by strong demand for hybrid and electrified vehicles in the US and other big markets and Toyota's market leadership in hybrids - something that's giving them a solid structural advantage as consumers are holding off on making the switch to all-electric vehicles. Toyota's hybrid models - think RAV4 Hybrid, Camry Hybrid and the Prius family - were outselling pure EV models in terms of volume and carrying stronger margins than the battery-only vehicles in Toyota's portfolio.
But when it comes to profits - well, that's a different story altogether. U.S. tariffs have really hammered the company, with an operating income of 3.8 trillion yen that was in line with expectations but down sharply on last year. And it's not like it was just a minor setback either - net income fell a whopping 19% when you factor in the impact of that 1.38 trillion yen in tariff costs.
To put that in some context, that's like a single year hit of 9.3 billion dollars - a headwind that dwarfs the annual R&D budgets of most car manufacturers. The company did announce that they will be raising their annual dividend from 95 yen per share to 100 yen per share next year while maintaining their share buyback programme.
FY2027 Guidance - What to Make of That ¥3.0T Operating Income Forecast
Management's projection for operating income in FY2027 is ¥3.0 trillion - a decline of ¥800 billion on the back of FY2026's ¥3.8 trillion. We're being told to expect this decrease due to the ongoing impact of US tariffs, some supply chain issues in the Middle East, increasing input costs and the fact that the company is still in the process of a pretty major structural transformation. The market's going to be watching closely to see if analysts think ¥3.0 trillion is the bare minimum Toyota is likely to hit - that's the sort of conservative forecast that Toyota's management has given us before - or if it's actually a fairly accurate picture.
Toyota's strategy of spreading its bets across a range of powertrain technologies - we're talking hybrids, plug-in hybrids, hydrogen and battery EVs - is turning out to be a wise move as the pace of EV adoption seems to be slowing down worldwide. And in North America and Europe at least, there's still plenty of life in hybrids, a market that Toyota is uniquely well placed to dominate given its scale and product range.
The boost to the dividend from ¥95 to ¥100 and new share buyback scheme from management does suggest they're fairly optimistic about the company's medium-term earnings prospects.
TM technical analysis — Fib 0.0 support at $185.61 with RSI positive divergence
Technically, TM stock is at $188, retesting the 0.0 Fibonacci base support at $185.61. The Relative Strength Index (RSI) is near 33, indicating oversold conditions, and shows positive divergence, which is a reliable early reversal signal in a downtrend.
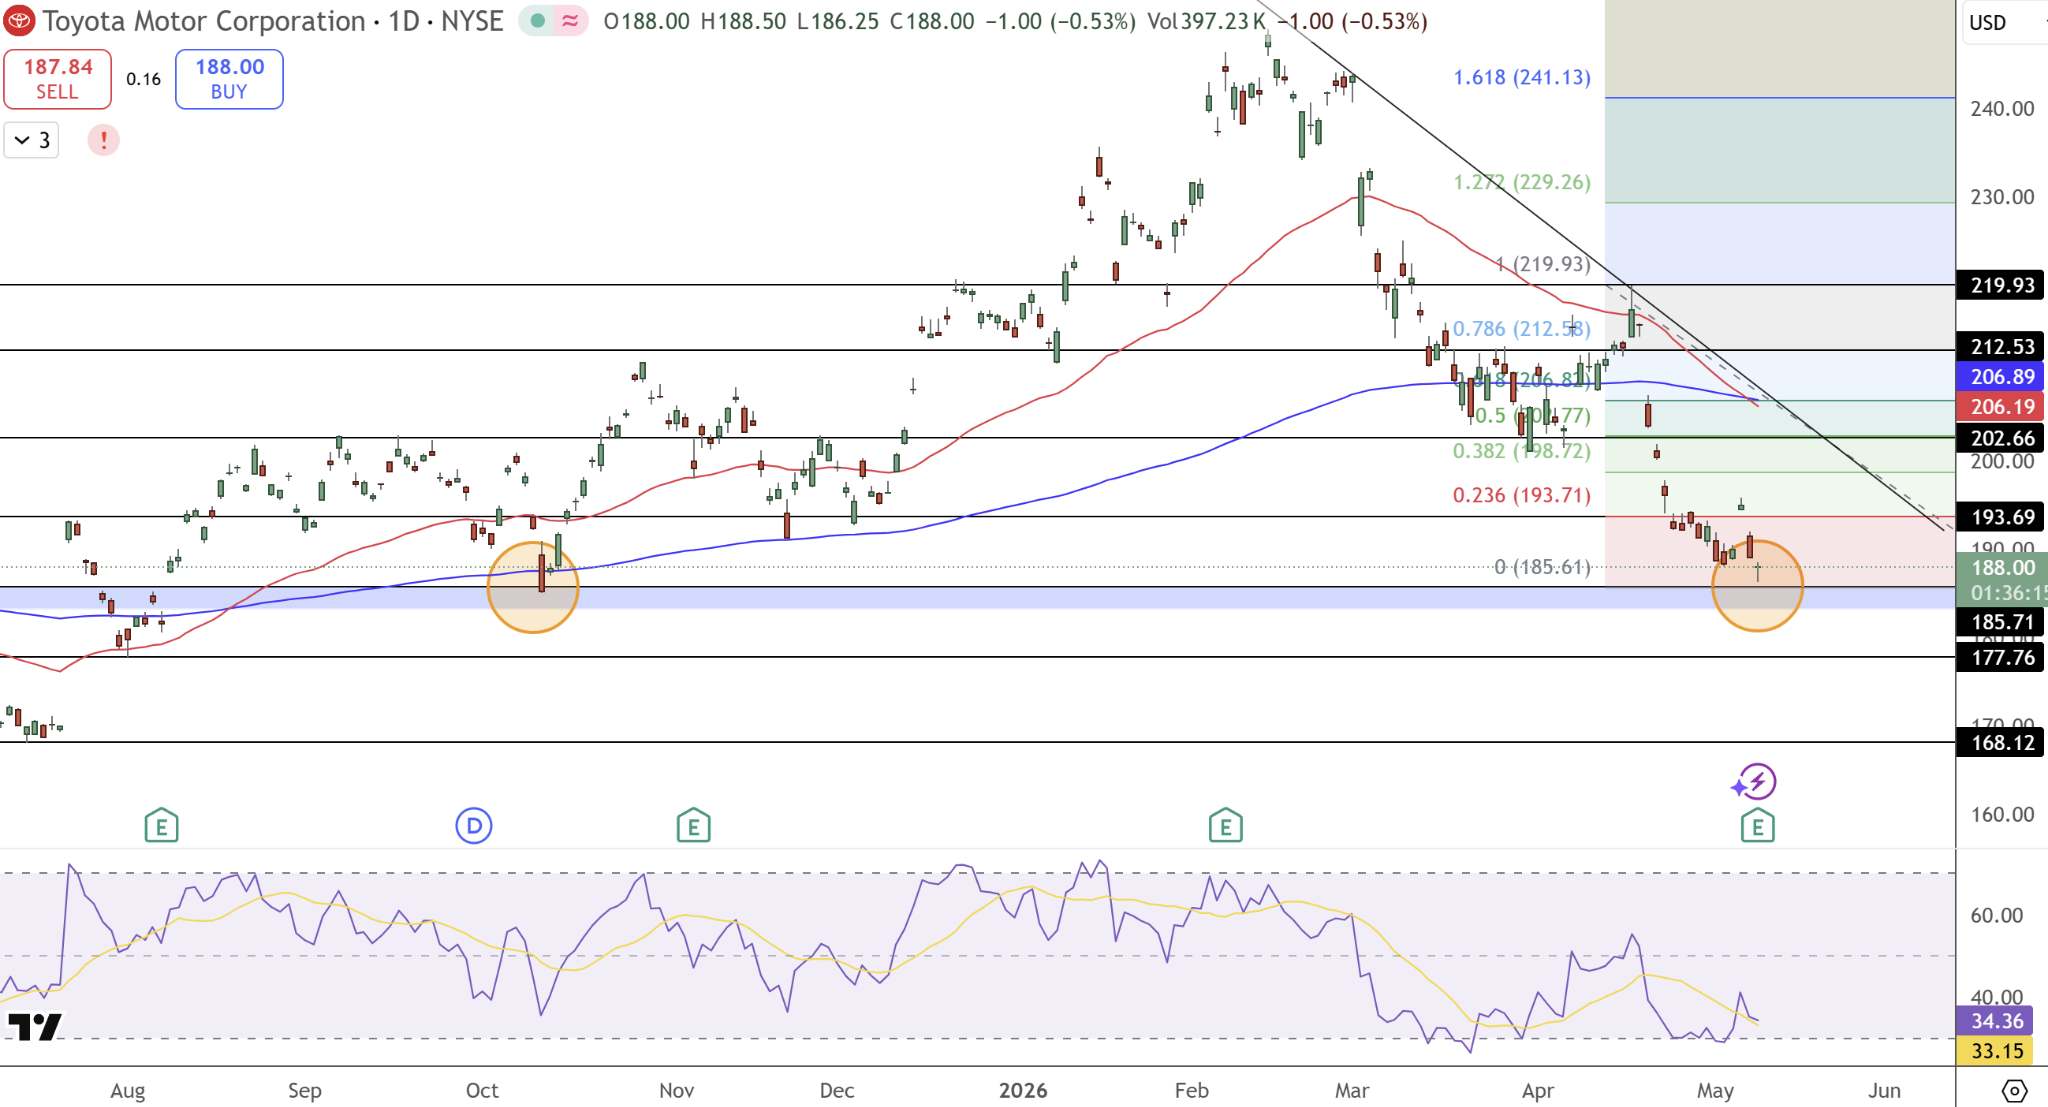
Toyota Motor (NYSE: TM) Price Chart - Source: Tradingview
Trade Setup
Entry: Long above $190 — clears the pinbar high with RSI divergence in place
Target 1: $198.72 — Fib 0.382 resistance
Target 2: $206.19 — Fib 0.618 and prior consolidation zone
Stop loss: Daily close below $185.61 — Fib 0.0 base breaks, deeper support $177.76
How did Toyota do in FY2026 earnings?
Toyota came out with a FY2026 operating income of ¥3.8 trillion in line with forecasts but down quite a lot compared to the previous year, thanks to the massive hit from US tariffs which alone will cost the company an estimated ¥1.38 trillion (about $9.3 billion). Net income took a 19% nose dive. On the plus side, the company's revenue reached a record ¥50 trillion with strong demand for its hybrids. The annual dividend got a boost, going up ¥5 per share to ¥95, and we're told to expect it to hit ¥100 a share in FY2027.
What is Toyota’s FY2027 earnings outlook?
Toyota's looking at FY2027 operating income of ¥3.0 trillion, an ¥800 billion drop from FY2026. The reason given is the ongoing impact of US tariffs combined with other hurdles like supply chain snags in the Middle East, increasing costs and the need for more profound change. Now historically, the company's managers have been a bit conservative with their forecasts, so the ¥3.0 trillion figure may be the bare minimum rather than a best case scenario. And the dividend is set to rise to ¥100 in FY2027 - that's got to be a pretty strong signal that the company's management team is feeling pretty confident about the long-term prospects, even if the immediate future is a bit tricky.
Is Toyota stock a buy at $188 after earnings?
Things look positive from a technical viewpoint - TM is down at the 0.0 point on its Fibonacci chart at $185.61, with the RSI at a low 33, a classic buy signal. If we see a rise above $190, the target is $198.72 and $206.19, with a stop-loss below $185.61. Now we've still got to factor in the inescapable fact that $1.38 trillion tariff hit and the 19% drop in net income are still major headaches. But on the other hand, we've got record revenue, a rising dividend commitment ( now going from ¥95 to ¥100) and hybrid dominance in North America all giving us a bit of a safety net. The real risk here is whether the ¥3.0 trillion operating income forecast for FY2027 will prove a bit too optimistic if the tariffs just keep ratcheting up.
Bottom Line
Toyota is taking a massive external hit in the form of these tariffs (¥1.38 trillion) and it's taking a big hit in earnings as a result. But on the plus side, the company is still pulling in record revenue and it's still raising its dividend - that's not something you can say about many companies. The cautious forecast for FY2027 is balanced out by the rock-solid business fundamentals and the rising dividend commitment. It's still all about whether these tariffs keep escalating.
Recommended Articles


