


Consumer Sentiment Is Low; History Shows That Could Actually Be Good for U.S. Stocks
Key Points
The U. of Michigan Consumer Sentiment Index just had its second-lowest reading ever.
So you might think that this would be a good time to get out of stocks.
Historically, however, the data comes to a different conclusion.
- 10 stocks we like better than S&P 500 Index ›
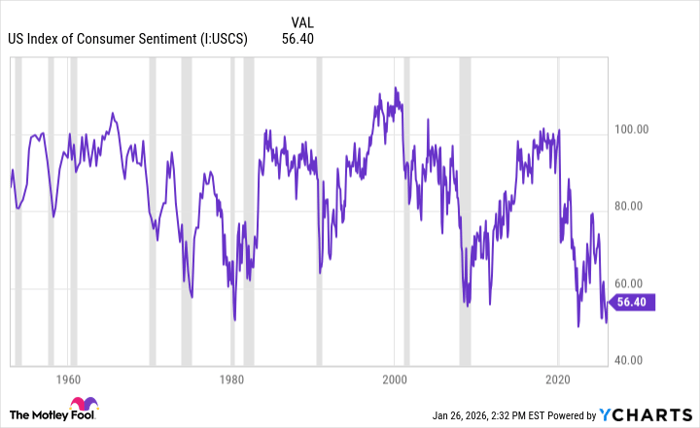
This past November, the University of Michigan Index of Consumer Sentiment hit 51. That's the second-lowest reading going back to the early 1950s. Instinctively, investors might think that it's a good time to get out of the equity markets when sentiment is at its worst. But does the data bear that out? Actually, it doesn't. Here's why.
Where to invest $1,000 right now? Our analyst team just revealed what they believe are the 10 best stocks to buy right now, when you join Stock Advisor. See the stocks »
US Index of Consumer Sentiment data by YCharts
Let's start by looking at one data point in the series. The lowest reading for this index is 50. That occurred in June 2022. This was the middle of the bear market that was triggered by ultra-high inflation rates and an aggressive Federal Reserve rate hiking cycle.
That might have seemed like the ideal time to get out of stocks. For a few months, it was. The S&P 500 didn't bottom until October of that year. Over the next 12 months, however, it was a different story. After that record low print, the S&P 500 gained more than 17%. Granted, that's a sample size of one out of 60-plus years of data. But the idea behind why it happened might be more obvious than you think.

Image source: Getty Images.
Famed investor Warren Buffett once said, "Be fearful when others are greedy, and greedy when others are fearful." What he's advocating for with that quote is a simple "buy low, sell high" strategy. When things look their worst, stock prices are (in theory) discounted. Buffett would say that's the time to buy.
This is a good example of that thesis playing out in reality. Sentiment was literally the worst it had ever been. Yet S&P 500 returns over the next year turned out to be pretty good. The next step would be to analyze the rest of the data to see if the same trends exist.
To start, I pulled each of the monthly Consumer Sentiment Index readings going back as far as was easily accessible, which was 1985. I also pulled month-end S&P 500 index values for the same period. My definition of forward-12-month index returns was to start with the beginning of the month following the report release date. For example, if the report was for January 1985, I looked at S&P 500 returns from Feb. 1, 1985 to Jan. 31, 1986.
I also grouped monthly report readings into 5-point "buckets." For example, a monthly reading of 76.4 would fall into the "75-79.9" group. Here are the results of my study.
| Consumer Sentiment Range | Number of Instances | Average Forward 12-Month S&P 500 Return |
|---|---|---|
| <55 | 2 | 14.34% |
| 55-59.9 | 16 | 12.65% |
| 60-64.9 | 16 | 11.57% |
| 65-69.9 | 31 | 10.97% |
| 70-74.9 | 39 | 11.39% |
| 75-79.9 | 40 | 11.25% |
| 80-84.9 | 45 | 7.91% |
| 85-89.9 | 55 | 9.79% |
| 90-94.9 | 116 | 9.69% |
| 95-99.9 | 70 | 12.47% |
| 100+ | 50 | 8.96% |
Data source: University of Michigan. Calculations by author.
While it's not necessarily a straight line, the results are pretty clear. S&P 500 returns over the next 12 months tend to be higher when Consumer Sentiment Index readings are lower. In other words, exactly what Warren Buffett said!
Of course, this isn't a foolproof strategy for investing. There are a lot of factors to consider in any individual situation, so any outcome is possible. But anything that allows you to tilt the scales in your favor is strongly worth considering.
Should you buy stock in S&P 500 Index right now?
Before you buy stock in S&P 500 Index, consider this:
The Motley Fool Stock Advisor analyst team just identified what they believe are the 10 best stocks for investors to buy now… and S&P 500 Index wasn’t one of them. The 10 stocks that made the cut could produce monster returns in the coming years.
Consider when Netflix made this list on December 17, 2004... if you invested $1,000 at the time of our recommendation, you’d have $448,476!* Or when Nvidia made this list on April 15, 2005... if you invested $1,000 at the time of our recommendation, you’d have $1,180,126!*
Now, it’s worth noting Stock Advisor’s total average return is 945% — a market-crushing outperformance compared to 197% for the S&P 500. Don't miss the latest top 10 list, available with Stock Advisor, and join an investing community built by individual investors for individual investors.
See the 10 stocks »
*Stock Advisor returns as of January 30, 2026.
David Dierking has no position in any of the stocks mentioned. The Motley Fool has no position in any of the stocks mentioned. The Motley Fool has a disclosure policy.
Recommended Articles


