

Top 3 Price Outlook: BTC Holds Above $89,000 as ETH Tests Resistance and XRP Stabilizes Near $1.90

- Gold Price Forecast: US Non-Farm Payrolls Miss Expectations, Gold Surges Over $100, Can the Bull Run Continue?
- Iran insists on control of Hormuz amid reports of US talks
- Gold gains momentum above $4,100 after weak US NFP data
- June Non-Farm Payrolls Preview: Did White House Economic Advisor Give an Early Hint? How Will US Stocks, Dollar and Gold React?
- WTI slips below $68.00 as supply concerns ease
- Bitcoin Price Trend Forecast: Continued ETF Outflows Limit Bitcoin Price Rebound Space, $58,000 Becomes Key Level for Bulls and Bears

Bitcoin is hovering around $89,000 on Wednesday after gaining nearly 3% so far this week following last week’s sharp correction.
Ethereum is approaching a key technical cluster, with $3,017 and the 50-day EMA at $3,101 in focus as the next confirmation levels.
XRP has bounced off support at $1.83 and is back near $1.90, but momentum signals still suggest traders should stay cautious.
Bitcoin (BTC), Ethereum (ETH) and Ripple (XRP) are extending a rebound this week after last week’s heavy drop. BTC is trading above $89,000, ETH above $3,000 and XRP above $1.90. All three are now pressing into nearby resistance zones, and a firm daily close above those levels would be needed to keep the recovery intact.
Bitcoin rebound depends on $87,787 holding
Bitcoin started to stabilize after last week’s 7.48% decline. On Monday, BTC closed back above the midpoint of a horizontal parallel channel at $87,787, then held that area again on Tuesday. At the time of writing on Wednesday, Bitcoin is trading near $89,300.
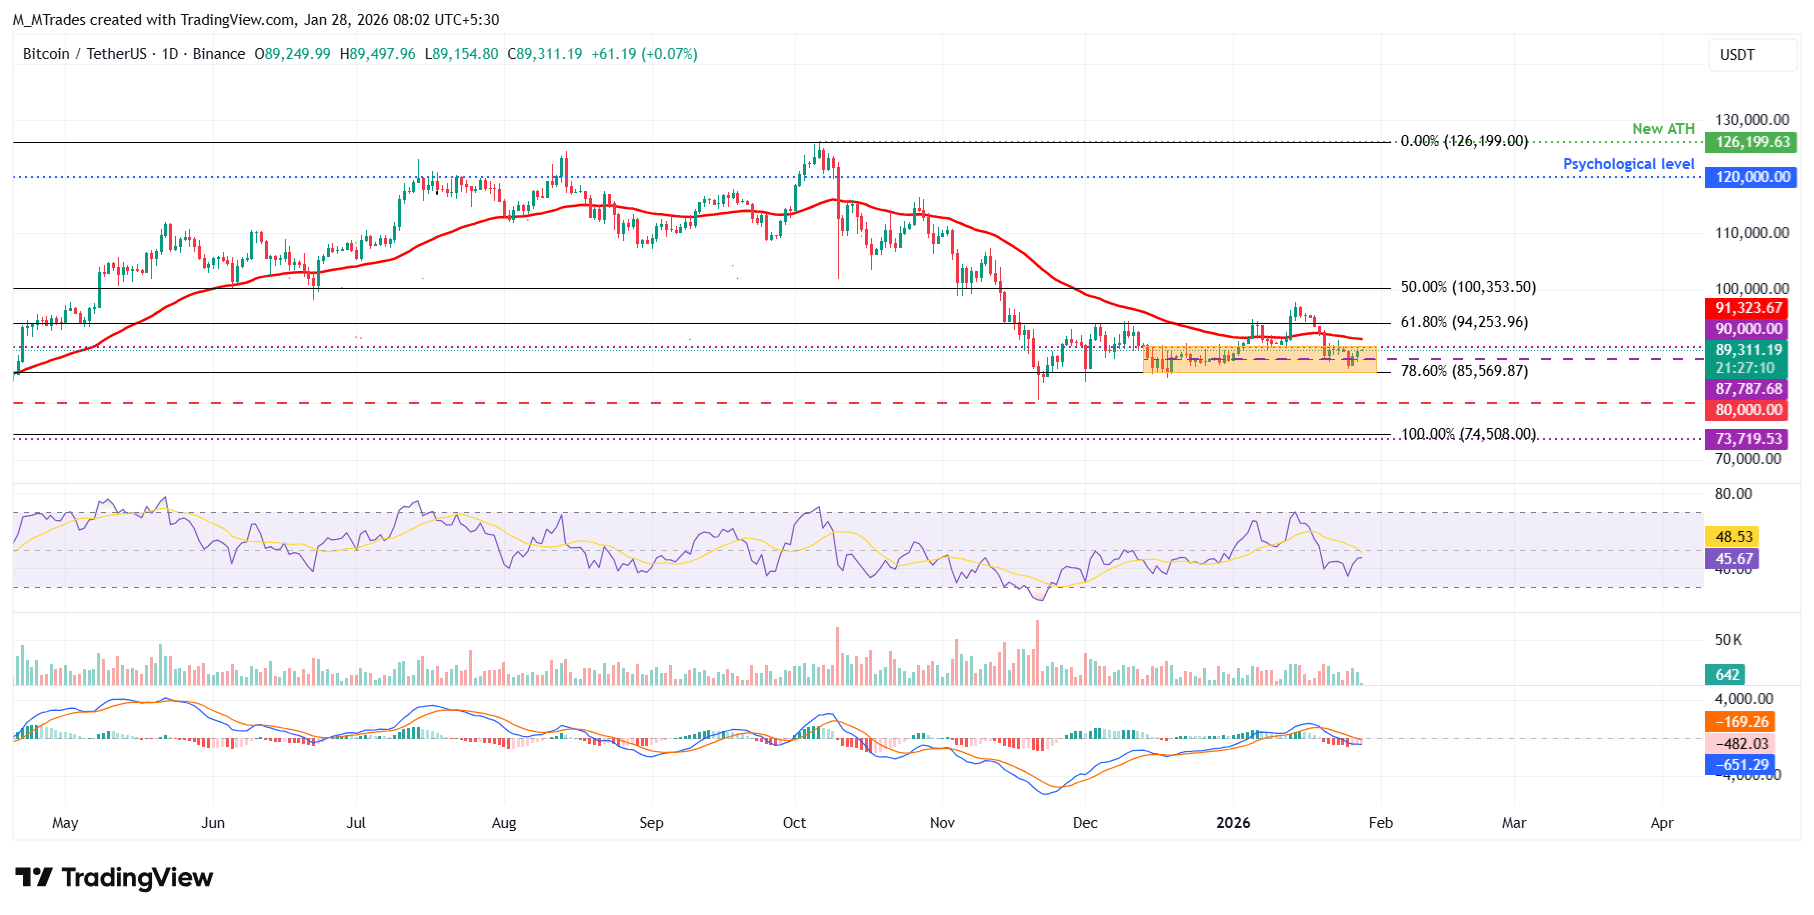
If $87,787 continues to act as support, BTC could keep climbing toward the upper boundary of the pattern at $90,000.
Momentum is improving but not fully reset. The daily RSI is 45 and rising toward the neutral 50 level, which signals that bearish pressure is easing. For the rebound to stay durable, RSI would need to push above 50. The MACD picture also looks less negative, with the lines converging and the red histogram bars below zero starting to fade, which supports the idea that downside momentum is weakening.
If BTC instead loses $87,787 on a daily close, price could slide toward the lower consolidation boundary at $85,569, which also matches the 78.6% Fibonacci retracement level.
Ethereum approaches a key resistance band
Ethereum opened the week stronger, rising 7.62% by Tuesday after falling 14.22% the week before. As of Wednesday, ETH is pressing up toward the daily resistance at $3,017.
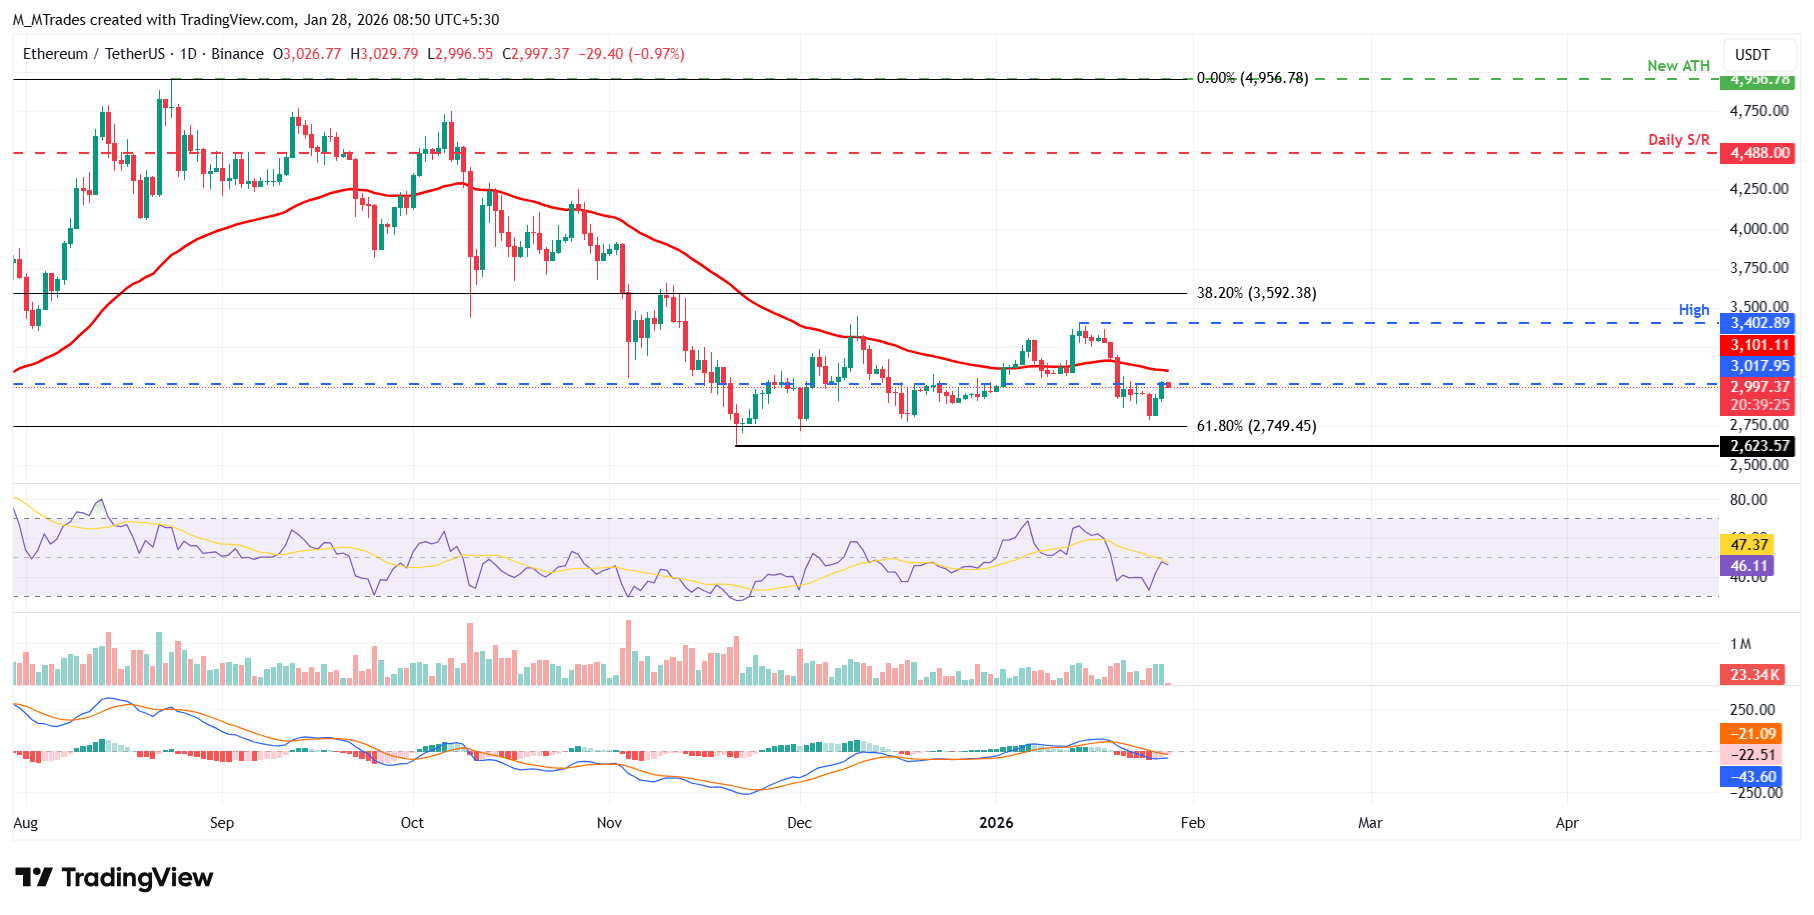
If ETH clears $3,017 and then posts a daily close above the 50-day EMA at $3,101, it could extend the rally toward the January 14 high at $3,402.
Momentum indicators are also starting to improve, with both RSI and MACD pointing to fading bearish pressure and a potential near-term rebound.
If ETH turns lower again, the next downside area highlighted in the setup is the 61.8% Fibonacci retracement level at $2,749.
XRP rebounds from $1.83 but momentum remains fragile
XRP retested the daily support at $1.83 on Sunday, held that level, and then rose 4.51% over the next two days. At the time of writing on Wednesday, XRP is trading around $1.90.
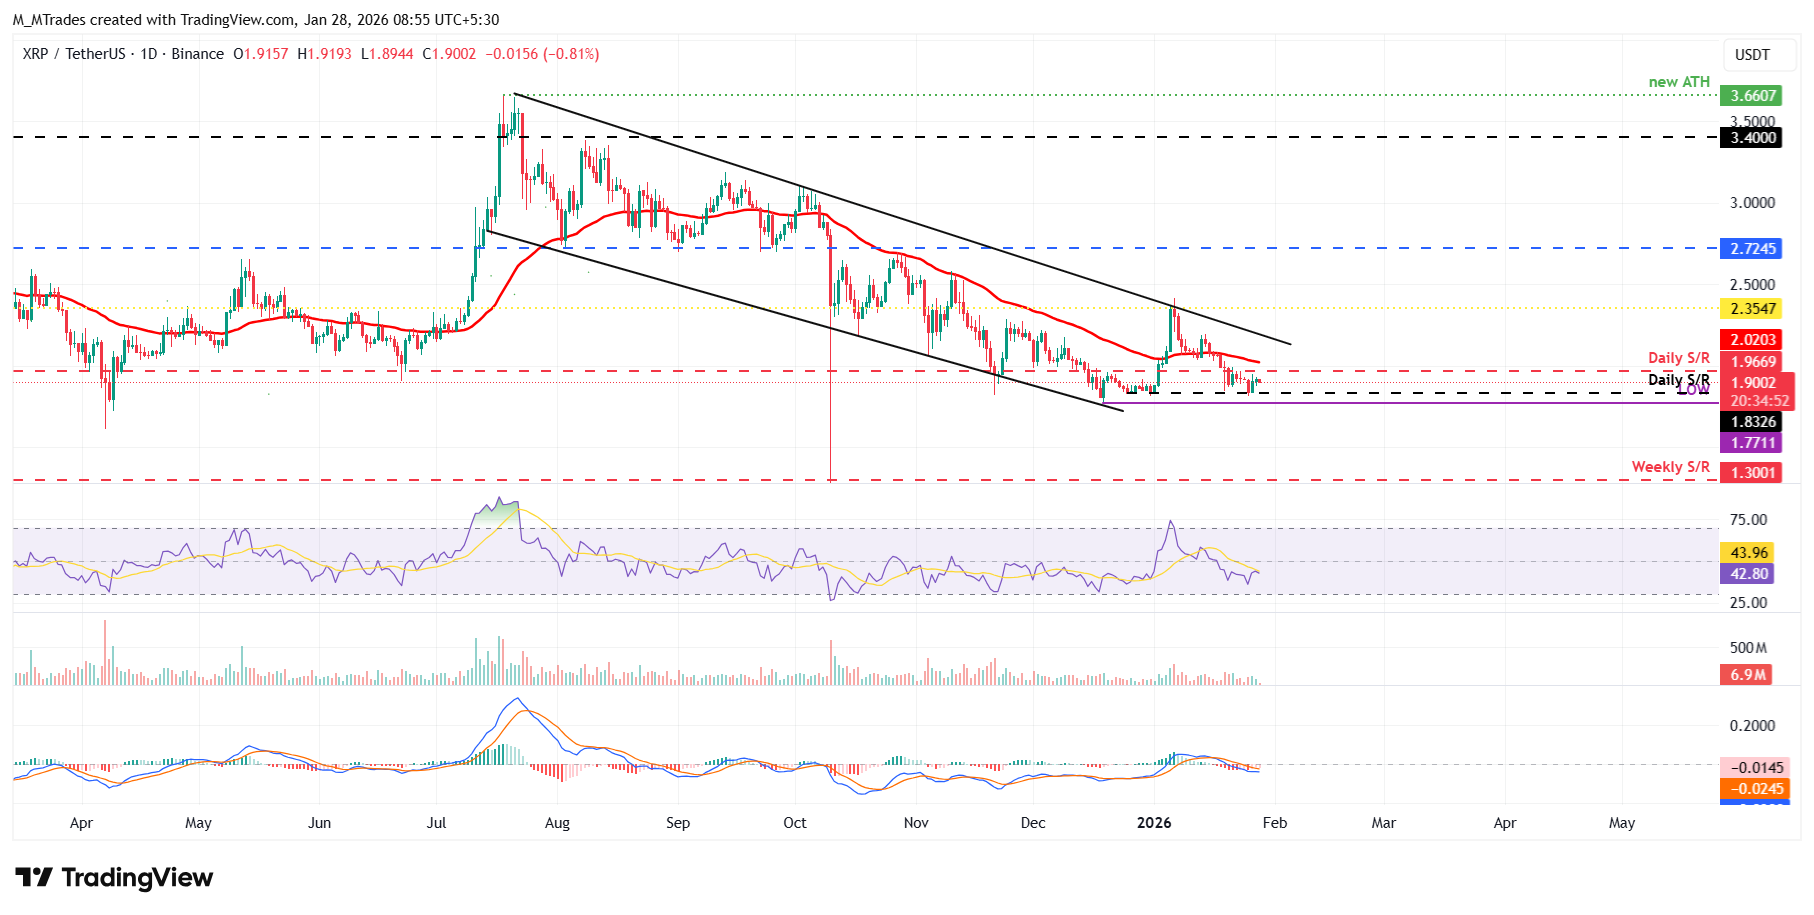
If $1.83 continues to hold, XRP could extend the recovery toward the next daily resistance at $1.96.
Still, the momentum backdrop remains mixed. The daily RSI is 42, below the neutral 50 level, which suggests bearish momentum is still present. For the recovery to look more convincing, RSI would need to move above 50. The MACD also remains a concern, as it printed a bearish crossover last week and that signal is still intact.
If XRP closes below $1.83, the chart would open the door for a move toward the December 19 low at $1.77.
Read more
The above content was completed with the assistance of AI and has been reviewed by an editor.


