
Wall Street's Ticking Time Bomb in 2026 Isn't Tariffs -- It's the Fed
Key Points
The third year of the bull market proved unstoppable, with the Dow Jones Industrial Average, S&P 500, and Nasdaq Composite gaining 13%, 16%, and 20%, respectively.
Several headwinds are mounting for the new year, including stock valuations and the potential impact of tariffs on the U.S. economy.
However, the biggest threat to the bull market in 2026 looks to be a historic level of division at the Federal Reserve.
- 10 stocks we like better than S&P 500 Index ›
The third year of the bull market on Wall Street didn't disappoint. The iconic Dow Jones Industrial Average (DJINDICES: ^DJI), broad-based S&P 500 (SNPINDEX: ^GSPC), and tech stock-dependent Nasdaq Composite (NASDAQINDEX: ^IXIC), respectively gained 13% 16%, and 20%, with all three indexes notching several record-closing highs.
Seeing the stock market deliver for investors is nothing new. Roughly 15 of the last 16 years have been spent in a bull market, with stocks outperforming all other asset classes, in terms of annualized return, over the last century.
Where to invest $1,000 right now? Our analyst team just revealed what they believe are the 10 best stocks to buy right now, when you join Stock Advisor. See the stocks »
But this doesn't guarantee that 2026 will lead to an encore performance for Wall Street's three major stock indexes. Headwinds have been mounting, ranging from valuation-based concerns to the potential impact of President Donald Trump's tariff and trade policy on America's economy. However, it's the stock market's historically stabilizing force, the Federal Reserve, that may prove to be Wall Street's ticking time bomb in the new year.

Fed Chair Jerome Powell delivering remarks. Image source: Official Federal Reserve Photo.
Stock market headwinds are mounting on Wall Street
To preface the following discussion, there are always catalysts that threaten to trigger a stock market correction. More often than not, the naysayers are proven wrong, and the Dow Jones, S&P 500, and Nasdaq Composite move higher. But once in a while, these stock market headwinds accurately portend trouble.
For instance, the S&P 500's Shiller Price-to-Earnings (P/E) Ratio, also known as the cyclically adjusted P/E Ratio or CAPE Ratio, entered the new year at its second priciest multiple during a continuous bull market in history. Whereas the Shiller P/E has averaged a multiple of 17.3 over the last 155 years, it closed out 2025 at more than 40.
Historical precedent makes clear that Shiller P/E multiples above 30 haven't been sustainable over the long term. While the CAPE Ratio isn't a timing tool, it does have a flawless track record of foreshadowing 20% or greater downturns in Wall Street's major stock indexes.
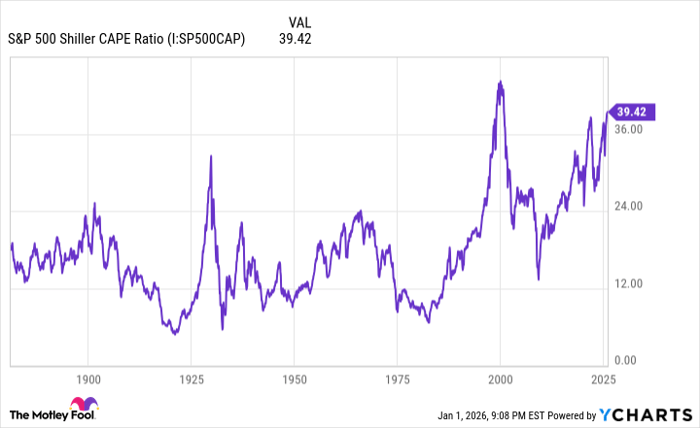
S&P 500 Shiller CAPE Ratio data by YCharts.
Arguably, even more attention is being paid to President Trump's tariffs and their potential impact on the U.S. economy/stock market.
In early April, the president unveiled a 10% global tariff and higher "reciprocal tariff" rates on dozens of countries that had adverse trade imbalances with America. Since this initial reveal, several trade deals have been reached, and numerous reciprocal tariff rates have been adjusted.
The worry, highlighted in a December 2024 report by four New York Federal Reserve economists writing for Liberty Street Economics ("Do Import Tariffs Protect U.S. Firms?"), is how tariffs will affect domestic manufacturers. Input tariffs -- duties placed on imported goods used to manufacture a product in the U.S. -- run the risk of increasing production costs, which are then passed along to consumers.
The four economists found that public companies directly impacted by Trump's tariffs in 2018 and 2019 endured, on average, declines in employment, labor productivity, sales, and profits from 2019 to 2021.
While these are two of the stock market's foremost headwinds, something more nefarious threatens to pull the rug out from under the S&P 500's three-year bull market rally -- the Federal Reserve.

Image source: Getty Images.
The Federal Reserve made dubious history in 2025 -- and it's a bad sign for the stock market
The Federal Reserve oversees our nation's monetary policy, with the specific goals of maximizing employment and stabilizing prices. Its 12-person policymaking body, the Federal Open Market Committee (FOMC), which includes Fed Chair Jerome Powell, attempts to reach its goals by adjusting the federal funds rate and conducting open market operations, such as the buying and selling of U.S. Treasury bonds to influence interest rates.
Typically, the nation's central bank is a calming force for Wall Street and investors. Even if monetary policy decisions by the FOMC are lagging (which isn't uncommon when decisions are being made by looking at economic data from previous months), there's often consensus among the one dozen members as to the path to take.
But what we've witnessed over the last six months from the Fed should worry investors. There have been dissenting policy opinions in each of the previous four FOMC meetings, with the October and December meetings making dubious history.
The last two meetings have featured dissents in opposite policy directions. In other words, at least one FOMC member favored no rate cut, while another lobbied for a 50-basis-point cut, instead of the 25-basis-point reduction in the federal funds target rate that was adopted. There have only been three FOMC meetings since 1990 with dissents in opposite directions, and two have occurred in the previous three months.
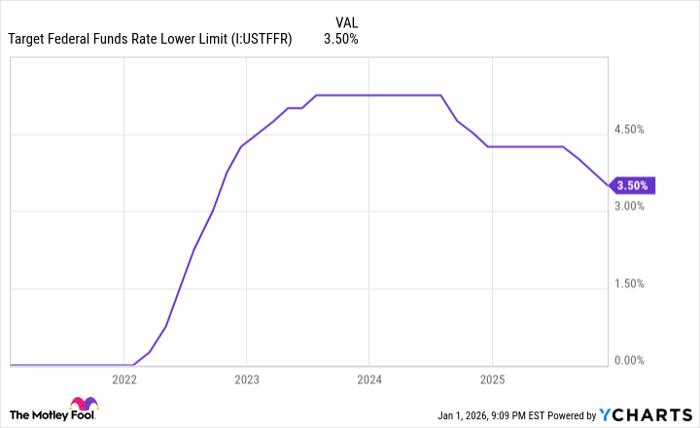
Target Federal Funds Rate Lower Limit data by YCharts.
While investors have previously been willing to tolerate (in hindsight) wrong or tardy policy moves by the Federal Reserve, the lack of a cohesive message is deeply concerning at a time when valuations are historically high, and tariffs are adding a degree of uncertainty to U.S. economic growth.
To complicate matters, Jerome Powell's term as Fed Chair comes to a close in May 2026. If President Trump's nominee to become the next Fed chair doesn't have the full support of Wall Street, it could lead to a true crisis of confidence for America's leading financial institution.
The silver lining is that some of Wall Street's proverbial ticking time bombs are eventually defused. For instance, another year of breakneck spending on artificial intelligence (AI) infrastructure quelled chatter of an AI bubble forming and subsequently bursting in 2025.
However, unifying a historically divided Fed, with turnover coming at the lead position in mere months, may be asking too much. If the shoe drops on Wall Street's bull market in 2026, the nation's central bank may well be the culprit.
Should you buy stock in S&P 500 Index right now?
Before you buy stock in S&P 500 Index, consider this:
The Motley Fool Stock Advisor analyst team just identified what they believe are the 10 best stocks for investors to buy now… and S&P 500 Index wasn’t one of them. The 10 stocks that made the cut could produce monster returns in the coming years.
Consider when Netflix made this list on December 17, 2004... if you invested $1,000 at the time of our recommendation, you’d have $490,703!* Or when Nvidia made this list on April 15, 2005... if you invested $1,000 at the time of our recommendation, you’d have $1,157,689!*
Now, it’s worth noting Stock Advisor’s total average return is 966% — a market-crushing outperformance compared to 194% for the S&P 500. Don't miss the latest top 10 list, available with Stock Advisor, and join an investing community built by individual investors for individual investors.
See the 10 stocks »
*Stock Advisor returns as of January 4, 2026.
Sean Williams has no position in any of the stocks mentioned. The Motley Fool has no position in any of the stocks mentioned. The Motley Fool has a disclosure policy.
Recommended Articles


