Is It Time to Load Up on This Dividend King Poised to Join the $1 Trillion Club in 2026?

Source The Motley Fool

Key Points

  • Advertising is Walmart's fastest-growing business segment.

  • It's being priced like a high-growth tech company, not a legacy retailer.

  • Being able to use its stores as delivery hubs has sped up Walmart's delivery services.

  • 10 stocks we like better than Walmart ›

For decades, Walmart (NASDAQ: WMT) has been a retail staple, with more than 10,000 stores across 19 countries. While retail remains its bread and butter, it's approaching the industry from a more modern direction, and it's been paying off for its business and stock.

Through Dec. 14, Walmart's stock is up more than 29%, outperforming the S&P 500 and putting the company on a path to join the trillion-dollar market cap club.

Where to invest $1,000 right now? Our analyst team just revealed what they believe are the 10 best stocks to buy right now. Continue »

At the time of this writing, Walmart's market cap is $930 billion. To hit the trillion-dollar mark in 2026, its stock would need to grow by around 7.5%. If it's able to accomplish this (and the current trillion-dollar companies remain), it would be the 12th trillion-dollar public company, and only the third non-tech company.

The outside of a Walmart retail store.

Image source: Getty Images.

Going beyond just brick-and-mortar sales

Walmart became a household name through its brick-and-mortar retail stores, but the company is expanding well beyond that. After losing the initial e-commerce battle to Amazon, Walmart has begun closing the gap.

Amazon's e-commerce business took off because of the delivery convenience it provided through Amazon Prime. Order today, and you can expect a package at your doorstep within two days.

Walmart is mastering the same approach, but it has one thing working in its favor that Amazon doesn't: Walmart can use its thousands of stores as de facto delivery hubs, whereas Amazon has to rely on its regional fulfillment centers.

This allows Walmart to make same-day delivery in many cases and gives consumers a reason to choose it over Amazon. This may not matter for some orders, but for things like groceries, Walmart's speed can make a world of difference, especially in rural areas.

In its fiscal third quarter, Walmart's U.S. and global e-commerce revenue grew 28% and 27%, respectively, outpacing its total revenue growth (5.8%).

WMT Revenue (Quarterly) Chart

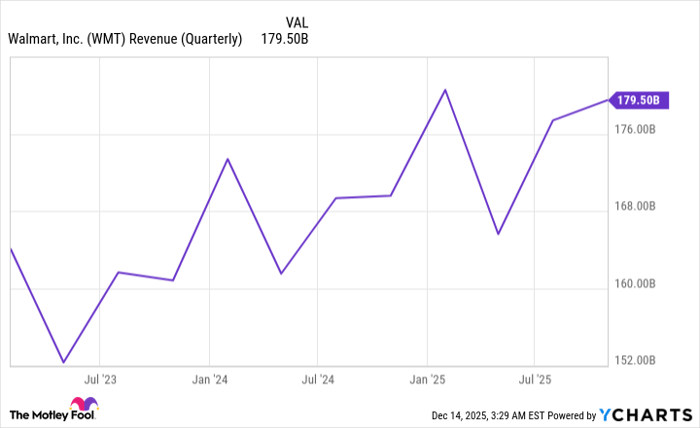
WMT Revenue (Quarterly) data by YCharts.

Advertising is bringing Walmart higher margins

The margins in retail are notoriously low, especially for Walmart, which generally prioritizes volume and low prices over higher margins. Selling $100 worth of goods may only bring a few dollars of profit in many cases. However, the company has been expanding its footprint in a much higher-margin business: advertising.

Walmart Connect is its advertising business, and it has been picking up steam. In the company's fiscal third quarter (ended Oct. 31), its global advertising grew 53%, while Walmart Connect in the U.S. grew 33%.

Advertising is a high-margin business because once the infrastructure is in place, it costs virtually nothing to sell and display another ad. And with the millions of people who shop at Walmart -- whether in person or online -- it has plenty of data to help advertisers with targeted campaigns.

In 2026, I expect Walmart's advertising revenue to continue to grow impressively. Its appeal should continue to increase, making it a go-to for advertisers looking for more eyes.

A dividend that you can count on

A Dividend King is a company that has increased its dividend annually for at least 50 consecutive years, and with 52 consecutive years of increases, it's a club that Walmart is proud to be a member of. The stock has had an impressive five-year run: up 138% compared to the S&P 500's 86% gains. But its dividend has long been a major selling point for investors looking for consistent income.

Its current quarterly payout is $0.235, with a yield just around 0.80%, so it's not a stock you come to for life-changing money. However, if you want reliability and consistency, Walmart's dividend provides that. You never have to second-guess it.

Walmart's stock doesn't come cheap

One thing working against Walmart is that its stock is priced fairly expensively by most standards. Its forward price-to-earnings ratio (P/E) is around 44.2, which is more than tech companies like Nvidia, Microsoft, Broadcom, and Alphabet.

WMT PE Ratio (Forward) Chart

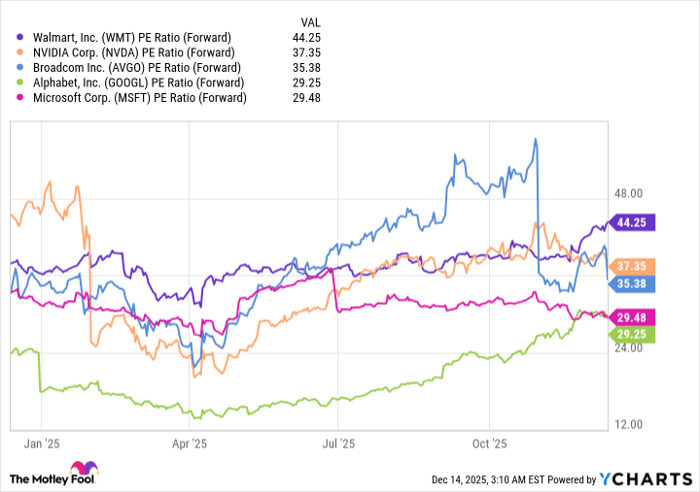
WMT PE Ratio (Forward), data by YCharts.

This high forward P/E ratio is an indication that Walmart is no longer being priced like a legacy retailer; it's being priced like a high-growth tech stock. It still has what it takes to hit the trillion-dollar mark in 2026, but a high valuation leaves less room for error in most cases. That said, 7.5% gains through 2026 should be in Walmart's plans.

Should you buy stock in Walmart right now?

Before you buy stock in Walmart, consider this:

The Motley Fool Stock Advisor analyst team just identified what they believe are the 10 best stocks for investors to buy now… and Walmart wasn’t one of them. The 10 stocks that made the cut could produce monster returns in the coming years.

Consider when Netflix made this list on December 17, 2004... if you invested $1,000 at the time of our recommendation, you’d have $505,695!* Or when Nvidia made this list on April 15, 2005... if you invested $1,000 at the time of our recommendation, you’d have $1,080,694!*

Now, it’s worth noting Stock Advisor’s total average return is 962% — a market-crushing outperformance compared to 193% for the S&P 500. Don't miss the latest top 10 list, available with Stock Advisor, and join an investing community built by individual investors for individual investors.

See the 10 stocks »

*Stock Advisor returns as of December 16, 2025.

Stefon Walters has positions in Microsoft. The Motley Fool has positions in and recommends Alphabet, Amazon, Microsoft, Nvidia, and Walmart. The Motley Fool recommends Broadcom and recommends the following options: long January 2026 $395 calls on Microsoft and short January 2026 $405 calls on Microsoft. The Motley Fool has a disclosure policy.

Disclaimer: For information purposes only. Past performance is not indicative of future results.
placeholder
U.S. November Nonfarm Payrolls: What Does the Rare "Weak Jobs, Strong Economy" Mix Mean for U.S. Equities?1. IntroductionAfter retreating from the late-October highs, U.S. equities embarked on a bottoming rebound in mid-to-late November, a trend driven by the interplay of multiple factors. That said, it i
Author  TradingKey
9 hours ago
1. IntroductionAfter retreating from the late-October highs, U.S. equities embarked on a bottoming rebound in mid-to-late November, a trend driven by the interplay of multiple factors. That said, it i
placeholder
Senate Delays Crypto Market Structure Hearings to Early 2026The Senate Banking Committee has postponed cryptocurrency market structure hearings until 2026, citing ongoing bipartisan negotiations.
Author  Mitrade
13 hours ago
The Senate Banking Committee has postponed cryptocurrency market structure hearings until 2026, citing ongoing bipartisan negotiations.
placeholder
Bitcoin Slides 5% as Sellers Lean In — Can BTC Reclaim $88,000?Bitcoin has dropped back below $88,000 after rolling over from $90,500, with price still trading under the 100-hour Simple Moving Average. The sell-off found a floor at $85,151, and BTC is now consolidating near that base, but rebounds are facing pressure from a bearish trend line around $89,000. Bulls need to retake $88,000–$89,000 to ease downside risk; failure to do so keeps $85,500–$85,000 and then $83,500 in play, with $80,000 as the deeper “line in the sand.” Bitcoin (BTC) is back in damage-control mode after a sharp pullback wiped out recent gains. The price failed to reclaim the $90,000–$90,500 band, rolled over, and slid through $88,500 before briefly dipping under $87,000. Buyers did show up around $85,000, but the rebound so far looks more like stabilization than a clear trend reversal. Bitcoin dips hard, finds a bid near $85,000(h3) BTC’s latest move lower began when it couldn’t build follow-through above $90,000 and $90,500. Once that upside stalled, sellers took control and pushed price down through $88,500. The slide accelerated enough to spike below $87,000, but the market didn’t free-fall. Bulls defended the $85,000 zone, printing a low at $85,151. Since then, Bitcoin has been consolidating below the 23.6% Fibonacci retracement of the drop from the $93,560 swing high to the $85,151 low — a clue that the bounce is still shallow and that sellers haven’t fully backed off yet. Structurally, BTC is still on the back foot: It’s trading below $88,000, and It remains below the 100-hour Simple Moving Average, keeping short-term trend pressure pointed downward. Resistance is layered, and $89,000 is the problem area(h3) If bulls try to turn this into a recovery, they’ll have to climb through multiple ceilings in quick succession. First, BTC faces resistance around $87,150, followed by a more meaningful barrier near $87,500. From there, the market’s attention snaps back to $88,000 — the level BTC just lost and now needs to reclaim. A close back above $88,000 would improve the tone, but it doesn’t solve the bigger issue: there’s a bearish trend line on the hourly BTC/USD chart (Kraken feed) with resistance near $89,000, which also lines up with the next technical hurdle. If BTC can push through $89,000 and hold, the rebound could extend toward $90,000, with follow-through targets at $91,000 and $91,500. But until price clears that $88,000–$89,000 zone, rallies are at risk of being sold rather than chased. If BTC fails to reclaim resistance, the downside path is clear(h3) The near-term bear case is simple: if Bitcoin can’t climb back above the $87,000 area and keep traction, sellers may attempt another leg lower. Support levels line up like this: Immediate support: $85,500 First major support: $85,000 Next support: $83,500 Then $82,500 in the near term Below that, the major “don’t break this” level is still $80,000. If BTC slips under $80,000, the risk of acceleration to the downside increases significantly — not because it’s magic, but because it’s the kind of psychological and structural level that tends to trigger forced de-risking. Indicators: momentum still leans bearish(h3) The intraday indicators aren’t offering much comfort yet: Hourly MACD is losing pace in the bearish zone. Hourly RSI remains below 50, suggesting sellers still have the upper hand on short timeframes. So while the $85,000 defense held for now, the market hasn’t flipped bullish — it’s just stopped bleeding.
Author  Mitrade
16 hours ago
Bitcoin has dropped back below $88,000 after rolling over from $90,500, with price still trading under the 100-hour Simple Moving Average. The sell-off found a floor at $85,151, and BTC is now consolidating near that base, but rebounds are facing pressure from a bearish trend line around $89,000. Bulls need to retake $88,000–$89,000 to ease downside risk; failure to do so keeps $85,500–$85,000 and then $83,500 in play, with $80,000 as the deeper “line in the sand.” Bitcoin (BTC) is back in damage-control mode after a sharp pullback wiped out recent gains. The price failed to reclaim the $90,000–$90,500 band, rolled over, and slid through $88,500 before briefly dipping under $87,000. Buyers did show up around $85,000, but the rebound so far looks more like stabilization than a clear trend reversal. Bitcoin dips hard, finds a bid near $85,000(h3) BTC’s latest move lower began when it couldn’t build follow-through above $90,000 and $90,500. Once that upside stalled, sellers took control and pushed price down through $88,500. The slide accelerated enough to spike below $87,000, but the market didn’t free-fall. Bulls defended the $85,000 zone, printing a low at $85,151. Since then, Bitcoin has been consolidating below the 23.6% Fibonacci retracement of the drop from the $93,560 swing high to the $85,151 low — a clue that the bounce is still shallow and that sellers haven’t fully backed off yet. Structurally, BTC is still on the back foot: It’s trading below $88,000, and It remains below the 100-hour Simple Moving Average, keeping short-term trend pressure pointed downward. Resistance is layered, and $89,000 is the problem area(h3) If bulls try to turn this into a recovery, they’ll have to climb through multiple ceilings in quick succession. First, BTC faces resistance around $87,150, followed by a more meaningful barrier near $87,500. From there, the market’s attention snaps back to $88,000 — the level BTC just lost and now needs to reclaim. A close back above $88,000 would improve the tone, but it doesn’t solve the bigger issue: there’s a bearish trend line on the hourly BTC/USD chart (Kraken feed) with resistance near $89,000, which also lines up with the next technical hurdle. If BTC can push through $89,000 and hold, the rebound could extend toward $90,000, with follow-through targets at $91,000 and $91,500. But until price clears that $88,000–$89,000 zone, rallies are at risk of being sold rather than chased. If BTC fails to reclaim resistance, the downside path is clear(h3) The near-term bear case is simple: if Bitcoin can’t climb back above the $87,000 area and keep traction, sellers may attempt another leg lower. Support levels line up like this: Immediate support: $85,500 First major support: $85,000 Next support: $83,500 Then $82,500 in the near term Below that, the major “don’t break this” level is still $80,000. If BTC slips under $80,000, the risk of acceleration to the downside increases significantly — not because it’s magic, but because it’s the kind of psychological and structural level that tends to trigger forced de-risking. Indicators: momentum still leans bearish(h3) The intraday indicators aren’t offering much comfort yet: Hourly MACD is losing pace in the bearish zone. Hourly RSI remains below 50, suggesting sellers still have the upper hand on short timeframes. So while the $85,000 defense held for now, the market hasn’t flipped bullish — it’s just stopped bleeding.
placeholder
AUD/USD remains depressed below mid-0.6600s; downside seems limited ahead of US NFP reportThe AUD/USD pair attracts some sellers for the fourth straight day on Tuesday and trades around the 0.6630 region, down just over 0.10%, during the Asian session.
Author  FXStreet
17 hours ago
The AUD/USD pair attracts some sellers for the fourth straight day on Tuesday and trades around the 0.6630 region, down just over 0.10%, during the Asian session.
placeholder
Macro Analysts: Hawkish Japan Could Push Bitcoin Below $70KAnalysts predict Bitcoin may face further declines towards the $70,000 mark if the Bank of Japan raises interest rates as expected.
Author  Mitrade
Yesterday 05: 48
Analysts predict Bitcoin may face further declines towards the $70,000 mark if the Bank of Japan raises interest rates as expected.
goTop
quote