Should You Buy the 5 Highest-Paying Dividend Stocks in the Dow Jones Before 2026?

Source The Motley Fool

Key Points

  • The Dow Jones tracks 30 of the largest American companies across different sectors.

  • Verizon, Chevron, and Merck hold the highest dividend yields in the Dow Jones.

  • Chevron, Merck, and Coca-Cola stand out as buys heading into 2026.

  • 10 stocks we like better than Chevron ›

The Dow Jones, formally known as the Dow Jones Industrial Average (DJIA), is one of the U.S. stock market's three main indexes, alongside the S&P 500 and Nasdaq Composite. It tracks 30 of the largest American companies on the market, aiming to give insight into the health of the U.S. stock market.

Since the Dow Jones typically tracks large, mature companies, those companies generally pay a dividend. The only exceptions are Amazon, which has never paid one, and Boeing, which suspended its dividend in 2020.

Where to invest $1,000 right now? Our analyst team just revealed what they believe are the 10 best stocks to buy right now. Continue »

However, if you're looking for a high-yield dividend stock in the Dow Jones, there are several to choose from today. Below are the Dow Jones' top five highest-paying dividend stocks and whether or not they make for a sound investment going into the new year.

VZ Dividend Yield Chart

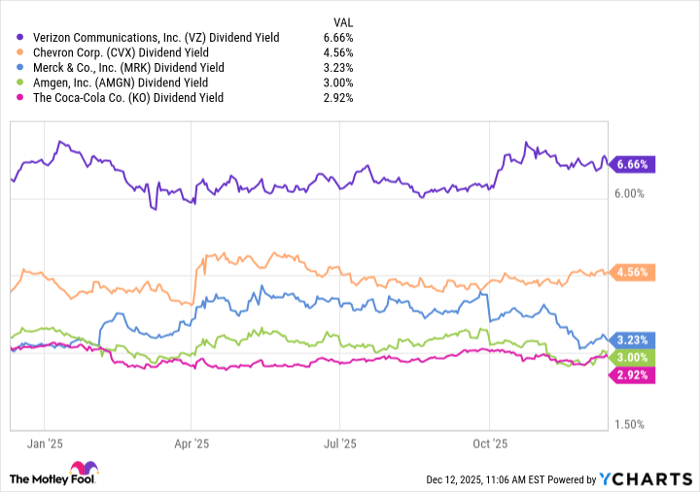
VZ Dividend Yield data by YCharts

1. Verizon: 6.66%

Verizon Communications (NYSE: VZ) is one of the largest telecom companies in the world and also boasts one of the highest dividends that you'll find on the market. Stock price growth is nice, yes, but when you invest in Verizon, it's generally to take advantage of its dividend.

Verizon's payout is higher than you'd receive from a high-yield savings account or government bonds, so it's a smart place to put money to work. If the Federal Reserve continues to cut interest rates, Verizon's dividend will look even more attractive to those seeking passive income.

2. Chevron: 4.55%

Chevron (NYSE: CVX) is a cash cow that has stood the test of time, regardless of how cyclical the oil industry can be with its volatile prices. Over the past four quarters, it has generated close to $187 billion in revenue, so if there's one thing to know about Chevron's dividend, it's that the business fully supports it.

Chevron stands out as one of the top energy companies to invest in because it operates in all three phases of the oil and gas ecosystem: upstream (finding and producing), midstream (transporting and storing), and downstream (turning into fuels and marketing).

CVX Revenue (Quarterly) Chart

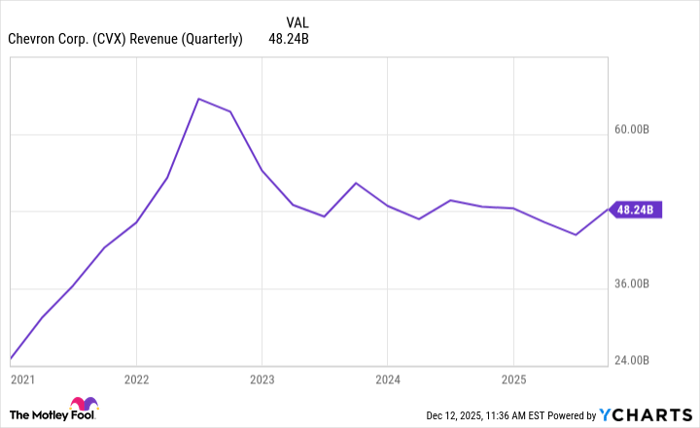
CVX Revenue (Quarterly) data by YCharts

3. Merck: 3.23%

Merck (NYSE: MRK) is a pharmaceutical company known for drugs such as Keytruda and Gardasil. In addition to those, it has a robust pipeline of new drugs in the works, including those focused on treating cancer and fighting heart disease.

It will lose the patent for one of its best sellers, the cancer drug Keytruda, in 2028, but the company is working to diversify its drug portfolio to help offset potential revenue loss.

Even so, investors don't have to worry about Merck's dividend being affected. It has a history of being shareholder-friendly and keeping the dividend in line with earnings growth.

4. Amgen: 3%

Amgen (NASDAQ: AMGN) is the other pharmaceutical company on the list, and has surprisingly outperformed the market so far this year after lagging a bit in previous years. It has a couple of medicines, Repatha and Tezspire, that are driving a lot of its current growth, but it has drugs in its pipeline that will hopefully help as it approaches losses to key patents.

Amgen has increased its annual dividend every year since it started paying them in 2011, and that's a streak I expect to continue. Its current payout ratio is below 50%, so its financials support its dividend with ease.

5. Coca-Cola: 2.92%

Coca-Cola (NYSE: KO) is undoubtedly the best-known company on the list, boasting one of the most recognizable brands in the world, regardless of industry. With 63 consecutive years of annual dividend increases, Coca-Cola is also the only Dividend King on the list (a company with at least 50 consecutive years of increases).

When you invest in Coca-Cola, you know you're investing in a company that has a trifecta: a brand moat, products that sell regardless of economic conditions, and a reliable dividend. It's a company that has been, and should continue to be, a staple in many investors' portfolios.

Should you invest in these stocks?

There's a bullish case to be made for each stock on this list. However, if any companies stood out as buys heading into the new year, it would be Chevron, Merck, and Coca-Cola.

If you're interested in investing in the Dow Jones as a whole, a good option is the SPDR Dow Jones Industrial Average ETF (NYSEMKT: DIA). Its dividend yield is only 1.46%, but that's still higher than the S&P 500 average, and ETF investing removes the risks that come with investing in individual stocks.

Should you buy stock in Chevron right now?

Before you buy stock in Chevron, consider this:

The Motley Fool Stock Advisor analyst team just identified what they believe are the 10 best stocks for investors to buy now… and Chevron wasn’t one of them. The 10 stocks that made the cut could produce monster returns in the coming years.

Consider when Netflix made this list on December 17, 2004... if you invested $1,000 at the time of our recommendation, you’d have $505,695!* Or when Nvidia made this list on April 15, 2005... if you invested $1,000 at the time of our recommendation, you’d have $1,080,694!*

Now, it’s worth noting Stock Advisor’s total average return is 962% — a market-crushing outperformance compared to 193% for the S&P 500. Don't miss the latest top 10 list, available with Stock Advisor, and join an investing community built by individual investors for individual investors.

See the 10 stocks »

*Stock Advisor returns as of December 16, 2025.

Stefon Walters has positions in Coca-Cola. The Motley Fool has positions in and recommends Amazon, Amgen, Boeing, Chevron, and Merck. The Motley Fool recommends Verizon Communications. The Motley Fool has a disclosure policy.

Disclaimer: For information purposes only. Past performance is not indicative of future results.
placeholder
U.S. November Nonfarm Payrolls: What Does the Rare "Weak Jobs, Strong Economy" Mix Mean for U.S. Equities?1. IntroductionAfter retreating from the late-October highs, U.S. equities embarked on a bottoming rebound in mid-to-late November, a trend driven by the interplay of multiple factors. That said, it i
Author  TradingKey
9 hours ago
1. IntroductionAfter retreating from the late-October highs, U.S. equities embarked on a bottoming rebound in mid-to-late November, a trend driven by the interplay of multiple factors. That said, it i
placeholder
Senate Delays Crypto Market Structure Hearings to Early 2026The Senate Banking Committee has postponed cryptocurrency market structure hearings until 2026, citing ongoing bipartisan negotiations.
Author  Mitrade
13 hours ago
The Senate Banking Committee has postponed cryptocurrency market structure hearings until 2026, citing ongoing bipartisan negotiations.
placeholder
Bitcoin Slides 5% as Sellers Lean In — Can BTC Reclaim $88,000?Bitcoin has dropped back below $88,000 after rolling over from $90,500, with price still trading under the 100-hour Simple Moving Average. The sell-off found a floor at $85,151, and BTC is now consolidating near that base, but rebounds are facing pressure from a bearish trend line around $89,000. Bulls need to retake $88,000–$89,000 to ease downside risk; failure to do so keeps $85,500–$85,000 and then $83,500 in play, with $80,000 as the deeper “line in the sand.” Bitcoin (BTC) is back in damage-control mode after a sharp pullback wiped out recent gains. The price failed to reclaim the $90,000–$90,500 band, rolled over, and slid through $88,500 before briefly dipping under $87,000. Buyers did show up around $85,000, but the rebound so far looks more like stabilization than a clear trend reversal. Bitcoin dips hard, finds a bid near $85,000(h3) BTC’s latest move lower began when it couldn’t build follow-through above $90,000 and $90,500. Once that upside stalled, sellers took control and pushed price down through $88,500. The slide accelerated enough to spike below $87,000, but the market didn’t free-fall. Bulls defended the $85,000 zone, printing a low at $85,151. Since then, Bitcoin has been consolidating below the 23.6% Fibonacci retracement of the drop from the $93,560 swing high to the $85,151 low — a clue that the bounce is still shallow and that sellers haven’t fully backed off yet. Structurally, BTC is still on the back foot: It’s trading below $88,000, and It remains below the 100-hour Simple Moving Average, keeping short-term trend pressure pointed downward. Resistance is layered, and $89,000 is the problem area(h3) If bulls try to turn this into a recovery, they’ll have to climb through multiple ceilings in quick succession. First, BTC faces resistance around $87,150, followed by a more meaningful barrier near $87,500. From there, the market’s attention snaps back to $88,000 — the level BTC just lost and now needs to reclaim. A close back above $88,000 would improve the tone, but it doesn’t solve the bigger issue: there’s a bearish trend line on the hourly BTC/USD chart (Kraken feed) with resistance near $89,000, which also lines up with the next technical hurdle. If BTC can push through $89,000 and hold, the rebound could extend toward $90,000, with follow-through targets at $91,000 and $91,500. But until price clears that $88,000–$89,000 zone, rallies are at risk of being sold rather than chased. If BTC fails to reclaim resistance, the downside path is clear(h3) The near-term bear case is simple: if Bitcoin can’t climb back above the $87,000 area and keep traction, sellers may attempt another leg lower. Support levels line up like this: Immediate support: $85,500 First major support: $85,000 Next support: $83,500 Then $82,500 in the near term Below that, the major “don’t break this” level is still $80,000. If BTC slips under $80,000, the risk of acceleration to the downside increases significantly — not because it’s magic, but because it’s the kind of psychological and structural level that tends to trigger forced de-risking. Indicators: momentum still leans bearish(h3) The intraday indicators aren’t offering much comfort yet: Hourly MACD is losing pace in the bearish zone. Hourly RSI remains below 50, suggesting sellers still have the upper hand on short timeframes. So while the $85,000 defense held for now, the market hasn’t flipped bullish — it’s just stopped bleeding.
Author  Mitrade
16 hours ago
Bitcoin has dropped back below $88,000 after rolling over from $90,500, with price still trading under the 100-hour Simple Moving Average. The sell-off found a floor at $85,151, and BTC is now consolidating near that base, but rebounds are facing pressure from a bearish trend line around $89,000. Bulls need to retake $88,000–$89,000 to ease downside risk; failure to do so keeps $85,500–$85,000 and then $83,500 in play, with $80,000 as the deeper “line in the sand.” Bitcoin (BTC) is back in damage-control mode after a sharp pullback wiped out recent gains. The price failed to reclaim the $90,000–$90,500 band, rolled over, and slid through $88,500 before briefly dipping under $87,000. Buyers did show up around $85,000, but the rebound so far looks more like stabilization than a clear trend reversal. Bitcoin dips hard, finds a bid near $85,000(h3) BTC’s latest move lower began when it couldn’t build follow-through above $90,000 and $90,500. Once that upside stalled, sellers took control and pushed price down through $88,500. The slide accelerated enough to spike below $87,000, but the market didn’t free-fall. Bulls defended the $85,000 zone, printing a low at $85,151. Since then, Bitcoin has been consolidating below the 23.6% Fibonacci retracement of the drop from the $93,560 swing high to the $85,151 low — a clue that the bounce is still shallow and that sellers haven’t fully backed off yet. Structurally, BTC is still on the back foot: It’s trading below $88,000, and It remains below the 100-hour Simple Moving Average, keeping short-term trend pressure pointed downward. Resistance is layered, and $89,000 is the problem area(h3) If bulls try to turn this into a recovery, they’ll have to climb through multiple ceilings in quick succession. First, BTC faces resistance around $87,150, followed by a more meaningful barrier near $87,500. From there, the market’s attention snaps back to $88,000 — the level BTC just lost and now needs to reclaim. A close back above $88,000 would improve the tone, but it doesn’t solve the bigger issue: there’s a bearish trend line on the hourly BTC/USD chart (Kraken feed) with resistance near $89,000, which also lines up with the next technical hurdle. If BTC can push through $89,000 and hold, the rebound could extend toward $90,000, with follow-through targets at $91,000 and $91,500. But until price clears that $88,000–$89,000 zone, rallies are at risk of being sold rather than chased. If BTC fails to reclaim resistance, the downside path is clear(h3) The near-term bear case is simple: if Bitcoin can’t climb back above the $87,000 area and keep traction, sellers may attempt another leg lower. Support levels line up like this: Immediate support: $85,500 First major support: $85,000 Next support: $83,500 Then $82,500 in the near term Below that, the major “don’t break this” level is still $80,000. If BTC slips under $80,000, the risk of acceleration to the downside increases significantly — not because it’s magic, but because it’s the kind of psychological and structural level that tends to trigger forced de-risking. Indicators: momentum still leans bearish(h3) The intraday indicators aren’t offering much comfort yet: Hourly MACD is losing pace in the bearish zone. Hourly RSI remains below 50, suggesting sellers still have the upper hand on short timeframes. So while the $85,000 defense held for now, the market hasn’t flipped bullish — it’s just stopped bleeding.
placeholder
AUD/USD remains depressed below mid-0.6600s; downside seems limited ahead of US NFP reportThe AUD/USD pair attracts some sellers for the fourth straight day on Tuesday and trades around the 0.6630 region, down just over 0.10%, during the Asian session.
Author  FXStreet
17 hours ago
The AUD/USD pair attracts some sellers for the fourth straight day on Tuesday and trades around the 0.6630 region, down just over 0.10%, during the Asian session.
placeholder
Macro Analysts: Hawkish Japan Could Push Bitcoin Below $70KAnalysts predict Bitcoin may face further declines towards the $70,000 mark if the Bank of Japan raises interest rates as expected.
Author  Mitrade
Yesterday 05: 48
Analysts predict Bitcoin may face further declines towards the $70,000 mark if the Bank of Japan raises interest rates as expected.
goTop
quote