Should You Buy the Vanguard S&P 500 ETF With the Stock Market at An All-Time High? History Offers a Clear Answer.

Source The Motley Fool

Key Points

  • The diversified nature of the S&P 500 index has fueled a compound annual return of 10.5% for investors since 1957.

  • The index offers exposure to the companies driving the artificial intelligence (AI) boom, in addition to banks, healthcare companies, and more.

  • The Vanguard S&P 500 ETF can help investors track the performance of the S&P 500, with very low holding costs.

  • 10 stocks we like better than Vanguard S&P 500 ETF ›

The S&P 500 (SNPINDEX: ^GSPC) index is made up of 500 companies from 11 different sectors of the economy. It's weighted by market capitalization, so its largest constituents -- which include artificial intelligence (AI) powerhouses like Nvidia and Alphabet -- have a much greater influence over its performance than the smallest.

The S&P 500 set a new record high last Thursday on the back of a 16% gain in 2025 so far, which is well above its average annual return since it was established in 1957. Accelerated returns have been common over the last few years, as AI fuels remarkable growth in the semiconductor, software, and cloud computing industries, and this dynamic is likely to persist for the foreseeable future.

Where to invest $1,000 right now? Our analyst team just revealed what they believe are the 10 best stocks to buy right now. Continue »

The Vanguard S&P 500 ETF (NYSEMKT: VOO) is a low-cost exchange-traded fund (ETF) that tracks the performance of the S&P 500. Should investors buy it with the index at an all-time high? History offers a clear answer.

An investor looking at a chart on their computer screen while holding a smartphone.

Image source: Getty Images.

High exposure to tech and AI, with a healthy splash of diversification

Information technology is the largest of the 11 S&P 500 sectors, with a weighting of 36.1%. The sector is home to three of the world's largest companies, Nvidia, Microsoft, and Apple, which have a combined market cap of $11.9 trillion, so its heavy influence isn't a surprise. Those three companies, along with many others in this sector, operate at the forefront of the AI revolution.

The S&P 500 has climbed by 78% since the beginning of 2023, which is when the AI boom started gathering momentum. But if we exclude the information technology sector, that return shrinks to just 52%, which truly highlights its significance.
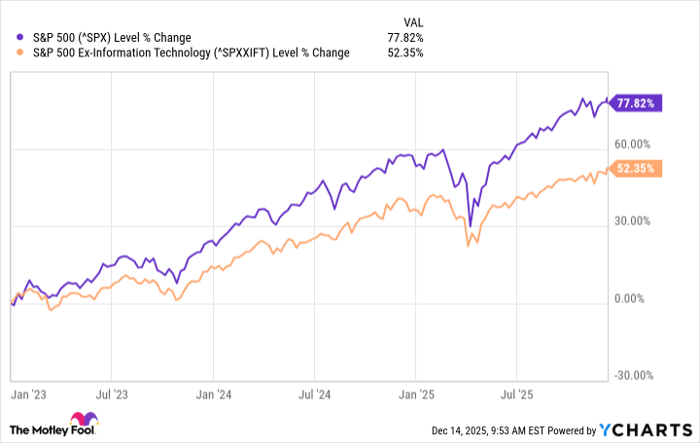
^SPX Chart

Data by YCharts.

The financial sector is the second largest in the S&P 500, with a weighting of 12.9%. It's home to Warren Buffett's trillion-dollar conglomerate Berkshire Hathaway, in addition to the world's biggest investment bank JPMorgan Chase, and payment giants Visa and Mastercard.

The consumer discretionary sector is third, with a weighting of 10.5%, thanks to tech-adjacent AI companies like Amazon and Tesla. Then there is the communication services sector at 10.1%, which hosts other AI powerhouses like Meta Platforms and Alphabet.

The remaining seven sectors in the S&P 500 include healthcare, industrials, consumer staples, energy, utilities, real estate, and materials, so it's highly diversified.

The Vanguard S&P 500 ETF is a great way to invest in the index because of its ultra-low cost. With an expense ratio of just 0.03%, an investment of $10,000 will incur an annual fee of just $3. Vanguard says comparable ETFs from other providers charge a whopping 24 times more, with an average expense ratio of 0.73%.

There is rarely a bad time to invest

Although past performance isn't always a reliable indicator of future results, the S&P 500 has a stellar long-term track record, with a compound annual return of 10.5% since its inception in 1957. However, it isn't always smooth sailing, and it's important to remember that sell-offs, corrections, and even bear markets are a normal part of the investing journey.

According to Capital Group, the S&P 500 experiences a decline of at least 5% once per year, on average. Steeper declines of at least 10% typically come around every two and a half years, and bear markets, which are defined by peak-to-trough declines of 20% or more, happen every six years or so.

The last bear market was in 2022, so unless there is an unexpected economic shock or an outright recession, history suggests investors could enjoy a few more years of positive returns before the next major downturn in the S&P 500.

Plus, there are some very strong tailwinds that should support further upside from here. First, the AI boom is expected to continue creating trillions of dollars in value, and second, the Federal Reserve is gradually lowering interest rates, which is typically positive for corporate earnings.

With all that said, the S&P 500 is trading at a historically elevated valuation right now, which does increase the risk of a correction in the near term. That doesn't mean investors should steer clear of the Vanguard S&P 500 ETF, but starting with a small position and adding to it consistently over time might be the best strategy from here. This will ensure a lower cost basis if the index does suffer a sharp sell-off.

Should you buy stock in Vanguard S&P 500 ETF right now?

Before you buy stock in Vanguard S&P 500 ETF, consider this:

The Motley Fool Stock Advisor analyst team just identified what they believe are the 10 best stocks for investors to buy now… and Vanguard S&P 500 ETF wasn’t one of them. The 10 stocks that made the cut could produce monster returns in the coming years.

Consider when Netflix made this list on December 17, 2004... if you invested $1,000 at the time of our recommendation, you’d have $513,353!* Or when Nvidia made this list on April 15, 2005... if you invested $1,000 at the time of our recommendation, you’d have $1,072,908!*

Now, it’s worth noting Stock Advisor’s total average return is 965% — a market-crushing outperformance compared to 193% for the S&P 500. Don't miss the latest top 10 list, available with Stock Advisor, and join an investing community built by individual investors for individual investors.

See the 10 stocks »

*Stock Advisor returns as of December 16, 2025.

JPMorgan Chase is an advertising partner of Motley Fool Money. Anthony Di Pizio has no position in any of the stocks mentioned. The Motley Fool has positions in and recommends Alphabet, Amazon, Apple, Berkshire Hathaway, JPMorgan Chase, Mastercard, Meta Platforms, Microsoft, Nvidia, Tesla, Vanguard S&P 500 ETF, and Visa. The Motley Fool recommends the following options: long January 2026 $395 calls on Microsoft and short January 2026 $405 calls on Microsoft. The Motley Fool has a disclosure policy.

Disclaimer: For information purposes only. Past performance is not indicative of future results.
placeholder
Gold Price Forecast: XAU/USD drifts higher above $4,200 as Fed delivers expected cutGold price (XAU/USD) gains momentum to around $4,235 during the early Asian session on Thursday. The precious metal extends its upside after the US Federal Reserve (Fed) delivered an expected third consecutive interest rate cut and maintained its outlook for just one cut in 2026.
Author  FXStreet
Dec 11, Thu
Gold price (XAU/USD) gains momentum to around $4,235 during the early Asian session on Thursday. The precious metal extends its upside after the US Federal Reserve (Fed) delivered an expected third consecutive interest rate cut and maintained its outlook for just one cut in 2026.
placeholder
Gold remains bid as lack of Fed clarity and geopolitical frictions persistGold (XAU/USD) advances modestly on Friday as traders seem to book profits ahead of the weekend, yet clings to gains of over 0.51% after reaching a seven-week high of $4,353. At the time of writing, XAU/USD trades at $4,302 as traders digest comments from Federal Reserve (Fed) officials.
Author  FXStreet
Yesterday 01: 34
Gold (XAU/USD) advances modestly on Friday as traders seem to book profits ahead of the weekend, yet clings to gains of over 0.51% after reaching a seven-week high of $4,353. At the time of writing, XAU/USD trades at $4,302 as traders digest comments from Federal Reserve (Fed) officials.
placeholder
Ethereum Price Slips Lower — $3,000 Looms as the Key BattlegroundEthereum is attempting to recover from a $3,026 low but remains below $3,200 and the 100-hour SMA, with a bearish trend line near $3,175 capping rebounds as bulls need a clean break above $3,200 to target $3,250–$3,400, while a drop below $3,050 risks a retest of $3,000 and $2,940.
Author  Mitrade
Yesterday 03: 25
Ethereum is attempting to recover from a $3,026 low but remains below $3,200 and the 100-hour SMA, with a bearish trend line near $3,175 capping rebounds as bulls need a clean break above $3,200 to target $3,250–$3,400, while a drop below $3,050 risks a retest of $3,000 and $2,940.
placeholder
Macro Analysts: Hawkish Japan Could Push Bitcoin Below $70KAnalysts predict Bitcoin may face further declines towards the $70,000 mark if the Bank of Japan raises interest rates as expected.
Author  Mitrade
Yesterday 05: 48
Analysts predict Bitcoin may face further declines towards the $70,000 mark if the Bank of Japan raises interest rates as expected.
placeholder
Bitcoin Slides 5% as Sellers Lean In — Can BTC Reclaim $88,000?Bitcoin has dropped back below $88,000 after rolling over from $90,500, with price still trading under the 100-hour Simple Moving Average. The sell-off found a floor at $85,151, and BTC is now consolidating near that base, but rebounds are facing pressure from a bearish trend line around $89,000. Bulls need to retake $88,000–$89,000 to ease downside risk; failure to do so keeps $85,500–$85,000 and then $83,500 in play, with $80,000 as the deeper “line in the sand.” Bitcoin (BTC) is back in damage-control mode after a sharp pullback wiped out recent gains. The price failed to reclaim the $90,000–$90,500 band, rolled over, and slid through $88,500 before briefly dipping under $87,000. Buyers did show up around $85,000, but the rebound so far looks more like stabilization than a clear trend reversal. Bitcoin dips hard, finds a bid near $85,000(h3) BTC’s latest move lower began when it couldn’t build follow-through above $90,000 and $90,500. Once that upside stalled, sellers took control and pushed price down through $88,500. The slide accelerated enough to spike below $87,000, but the market didn’t free-fall. Bulls defended the $85,000 zone, printing a low at $85,151. Since then, Bitcoin has been consolidating below the 23.6% Fibonacci retracement of the drop from the $93,560 swing high to the $85,151 low — a clue that the bounce is still shallow and that sellers haven’t fully backed off yet. Structurally, BTC is still on the back foot: It’s trading below $88,000, and It remains below the 100-hour Simple Moving Average, keeping short-term trend pressure pointed downward. Resistance is layered, and $89,000 is the problem area(h3) If bulls try to turn this into a recovery, they’ll have to climb through multiple ceilings in quick succession. First, BTC faces resistance around $87,150, followed by a more meaningful barrier near $87,500. From there, the market’s attention snaps back to $88,000 — the level BTC just lost and now needs to reclaim. A close back above $88,000 would improve the tone, but it doesn’t solve the bigger issue: there’s a bearish trend line on the hourly BTC/USD chart (Kraken feed) with resistance near $89,000, which also lines up with the next technical hurdle. If BTC can push through $89,000 and hold, the rebound could extend toward $90,000, with follow-through targets at $91,000 and $91,500. But until price clears that $88,000–$89,000 zone, rallies are at risk of being sold rather than chased. If BTC fails to reclaim resistance, the downside path is clear(h3) The near-term bear case is simple: if Bitcoin can’t climb back above the $87,000 area and keep traction, sellers may attempt another leg lower. Support levels line up like this: Immediate support: $85,500 First major support: $85,000 Next support: $83,500 Then $82,500 in the near term Below that, the major “don’t break this” level is still $80,000. If BTC slips under $80,000, the risk of acceleration to the downside increases significantly — not because it’s magic, but because it’s the kind of psychological and structural level that tends to trigger forced de-risking. Indicators: momentum still leans bearish(h3) The intraday indicators aren’t offering much comfort yet: Hourly MACD is losing pace in the bearish zone. Hourly RSI remains below 50, suggesting sellers still have the upper hand on short timeframes. So while the $85,000 defense held for now, the market hasn’t flipped bullish — it’s just stopped bleeding.
Author  Mitrade
9 hours ago
Bitcoin has dropped back below $88,000 after rolling over from $90,500, with price still trading under the 100-hour Simple Moving Average. The sell-off found a floor at $85,151, and BTC is now consolidating near that base, but rebounds are facing pressure from a bearish trend line around $89,000. Bulls need to retake $88,000–$89,000 to ease downside risk; failure to do so keeps $85,500–$85,000 and then $83,500 in play, with $80,000 as the deeper “line in the sand.” Bitcoin (BTC) is back in damage-control mode after a sharp pullback wiped out recent gains. The price failed to reclaim the $90,000–$90,500 band, rolled over, and slid through $88,500 before briefly dipping under $87,000. Buyers did show up around $85,000, but the rebound so far looks more like stabilization than a clear trend reversal. Bitcoin dips hard, finds a bid near $85,000(h3) BTC’s latest move lower began when it couldn’t build follow-through above $90,000 and $90,500. Once that upside stalled, sellers took control and pushed price down through $88,500. The slide accelerated enough to spike below $87,000, but the market didn’t free-fall. Bulls defended the $85,000 zone, printing a low at $85,151. Since then, Bitcoin has been consolidating below the 23.6% Fibonacci retracement of the drop from the $93,560 swing high to the $85,151 low — a clue that the bounce is still shallow and that sellers haven’t fully backed off yet. Structurally, BTC is still on the back foot: It’s trading below $88,000, and It remains below the 100-hour Simple Moving Average, keeping short-term trend pressure pointed downward. Resistance is layered, and $89,000 is the problem area(h3) If bulls try to turn this into a recovery, they’ll have to climb through multiple ceilings in quick succession. First, BTC faces resistance around $87,150, followed by a more meaningful barrier near $87,500. From there, the market’s attention snaps back to $88,000 — the level BTC just lost and now needs to reclaim. A close back above $88,000 would improve the tone, but it doesn’t solve the bigger issue: there’s a bearish trend line on the hourly BTC/USD chart (Kraken feed) with resistance near $89,000, which also lines up with the next technical hurdle. If BTC can push through $89,000 and hold, the rebound could extend toward $90,000, with follow-through targets at $91,000 and $91,500. But until price clears that $88,000–$89,000 zone, rallies are at risk of being sold rather than chased. If BTC fails to reclaim resistance, the downside path is clear(h3) The near-term bear case is simple: if Bitcoin can’t climb back above the $87,000 area and keep traction, sellers may attempt another leg lower. Support levels line up like this: Immediate support: $85,500 First major support: $85,000 Next support: $83,500 Then $82,500 in the near term Below that, the major “don’t break this” level is still $80,000. If BTC slips under $80,000, the risk of acceleration to the downside increases significantly — not because it’s magic, but because it’s the kind of psychological and structural level that tends to trigger forced de-risking. Indicators: momentum still leans bearish(h3) The intraday indicators aren’t offering much comfort yet: Hourly MACD is losing pace in the bearish zone. Hourly RSI remains below 50, suggesting sellers still have the upper hand on short timeframes. So while the $85,000 defense held for now, the market hasn’t flipped bullish — it’s just stopped bleeding.
goTop
quote