
The Stock Market Is Getting Dangerously Close to Becoming the Most Expensive It's Ever Been (Dating Back to 1871) -- and History Points to Trouble Ahead
Key Points
Following a bumpy start to 2025, it's been off to the races for the benchmark S&P 500, iconic Dow Jones Industrial Average, and technology-powered Nasdaq Composite.
An encompassing valuation tool that's analyzed more than 150 years of back-tested history has a stark warning for Wall Street and investors.
Thankfully, history cuts both directions and has undeniably favored optimistic, long-term-minded investors.
- 10 stocks we like better than S&P 500 Index ›
Although it's been a bumpy ride, 2025 has turned out to be another banner year for Wall Street and investors. Recently, the benchmark S&P 500 (SNPINDEX: ^GSPC), iconic Dow Jones Industrial Average (DJINDICES: ^DJI), and technology-inspired Nasdaq Composite (NASDAQINDEX: ^IXIC) all roared to record-closing highs.
Professional and everyday investors have a lot to be excited about:
Where to invest $1,000 right now? Our analyst team just revealed what they believe are the 10 best stocks to buy right now. Continue »
- The Federal Reserve has resumed its rate-easing cycle, which makes it less-costly to access capital and can fuel corporate hiring, innovation, and acquisitions.
- The simultaneous evolutions of artificial intelligence (AI) and quantum computing have investors contemplating pie-in-the-sky addressable opportunities.
- Wall Street's most influential businesses have, for the most part, been handily surpassing the consensus sales and profit expectations of analysts.
But when things seem too good to be true for the stock market, this often proves to be the case, based on what history tells us.
Image source: Getty Images.
We're within sight of the most expensive stock market in history
As the S&P 500, Dow Jones Industrial Average, and Nasdaq Composite have continued their seemingly uninterrupted march higher over the last six months and change, so have stock valuations.
Admittedly, there is no one-size-fits-all approach when it comes to valuing individual stocks or the broader market. Every investor has their own unique approach to determining what's cheap and what's pricey, which is what makes the stock market a market in the first place.
Most investors turn to the traditional price-to-earnings (P/E) ratio as the foundation for evaluating a stock. A company's P/E ratio is arrived at by dividing its share price into its trailing-12-month earnings per share (EPS), with a lower reading usually indicative of a better value.
But this time-tested valuation tool can be easily tripped up by shock events and recessions. If corporate profits turn into losses, the P/E ratio won't be of much help. This is where the Shiller P/E Ratio can come in handy. Note: the Shiller P/E is also commonly referred to as the cyclically adjusted P/E Ratio, or CAPE Ratio.
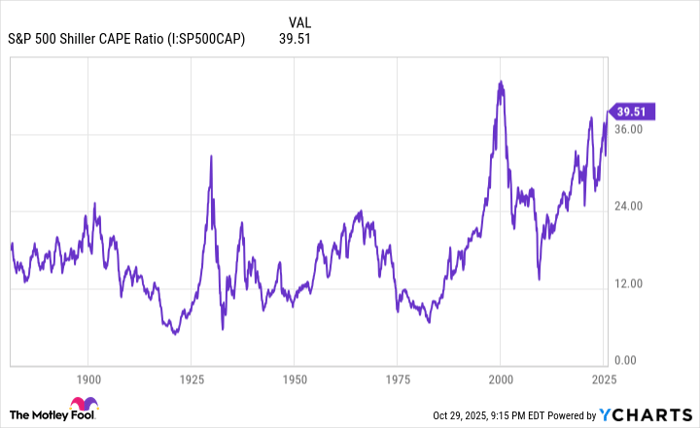
S&P 500 Shiller CAPE Ratio data by YCharts.
Whereas the P/E ratio is based on trailing-12-month EPS, the Shiller P/E is based on average inflation-adjusted EPS over the previous 10 years. This eliminates the possibility of shock events and recessions rendering it useless, as can happen for short periods with the traditional P/E ratio.
Though the Shiller P/E was introduced in 1988, this now-lauded valuation tool has been back-tested all the way to January 1871 on Wall Street's benchmark index, the S&P 500. Looking back more than 154 years, the average S&P 500 Shiller P/E multiple is a relatively tame 17.29.
As of the closing bell on Oct. 29, the S&P 500's Shiller P/E hit its highest multiple during the current bull market cycle (which began in October 2022) of 41.20. While the rise of the internet, which broke down information barriers for retail investors, and lower interest rates, have been catalysts for an above-average Shiller P/E multiple for much of the past 30 years, the stock market is now bordering on dubious history.
The highest-ever multiple for the S&P 500's Shiller P/E (44.19) occurred in December 1999, just a few months before the dot-com bubble burst. The stock market is now within sight of this all-time high.
Ladies and gentlemens, the Shiller P/E ratio hits 41 for the first time since the 2000 dot-com bubble.
-- The Great Martis (@great_martis) October 27, 2025
The only metric that barely sits under its high; every other metric has surpassed 2000.
Hope this helps. pic.twitter.com/Pp28g7KMlH
While this valuation premium is indicative of the optimism and excitement for AI, quantum computing, earnings growth, and ongoing rate cuts by the central bank, it's also a historical signal that trouble is brewing.
Dating back to January 1871, there have only been six documented instances, including the present, where the Shiller P/E surpassed 30 and held this level for a minimum of two months during a continuous bull market. The previous five occurrences were eventually followed by drawdowns ranging from 20% to 89% in one or more of Wall Street's major stock indexes. For instance, the Dow Jones Industrial Average shed 89% of its value following the Great Depression peak in the summer of 1929, while the S&P 500 and Nasdaq Composite dumped 49% and 78%, respectively, on a peak-to-trough basis after the dot-com bubble popped.
The beautiful thing about history is that it cuts right through the emotional aspects of investing and presents objective data. While the Shiller P/E is unable to tell us when stock reversals will occur, history makes clear that a valuation premium of the magnitude we're witnessing right now isn't sustainable.
Image source: Getty Images.
History cuts in both directions
Although this assessment may not be what investors want to hear, there is a silver lining: history cuts in both directions. Even though it might not offer the rosiest outlook over short periods, it has a way of calming nerves and delivering for optimistic, long-term-minded investors.
The fact of the matter is that stock market corrections, bear markets, and even those pesky elevator-down moves in the S&P 500, Dow Jones Industrial Average, and Nasdaq Composite, are perfectly normal and healthy events. No amount of well-wishing or fiscal/monetary policy maneuvering can prevent these typically emotion-driven moves from occurring.
On the other hand, history has repeatedly shown that patience and optimism pay off handsomely.
When the analysts at Crestmont Research examined every rolling 20-year period for the S&P 500 dating back to the start of the 20th century -- this required tracking the performance of its components in other indexes prior to the S&P's inception in 1923 -- they uncovered just how much of a moneymaker the stock market can be for patient investors.
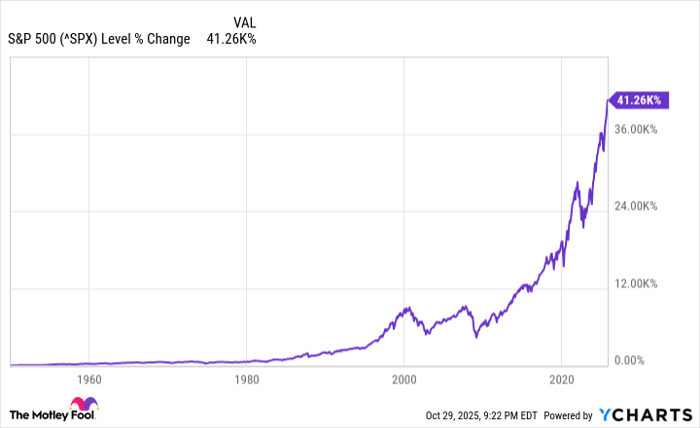
^SPX data by YCharts. The chart above only goes back as far as Jan. 3, 1950.
Crestmont analyzed 106 rolling 20-year periods (1900-1919, 1901-1920, and so on, through 2005-2024) and determined that all 106 had produced a positive total return, when factoring in dividends paid. What's more, these weren't small gains. Based on average annual total returns, 50% of these periods produced gains ranging from 9.3% to 17.1%, while the worst decile of average annual total returns was a still respectable 5.1%.
To put this analysis into further context, an investor could have, hypothetically (because index funds didn't exist until 1993 on U.S. exchanges), purchased an S&P 500-tracking index at any point between 1900 and 2005, held for 20 years, and made money. It didn't matter if there was a recession, depression, war, pandemic, high inflation, stagflation, or a stock market crash -- investors would have grown their nest egg every time if they simply stayed the course.
Eventually, a stock market correction, bear market, or elevator-down move will occur again. When it does, remember that history is a long-term ally, and that being optimistic is, statistically, the smartest path to generating riches on Wall Street over long periods.
Should you invest $1,000 in S&P 500 Index right now?
Before you buy stock in S&P 500 Index, consider this:
The Motley Fool Stock Advisor analyst team just identified what they believe are the 10 best stocks for investors to buy now… and S&P 500 Index wasn’t one of them. The 10 stocks that made the cut could produce monster returns in the coming years.
Consider when Netflix made this list on December 17, 2004... if you invested $1,000 at the time of our recommendation, you’d have $587,288!* Or when Nvidia made this list on April 15, 2005... if you invested $1,000 at the time of our recommendation, you’d have $1,243,688!*
Now, it’s worth noting Stock Advisor’s total average return is 1,055% — a market-crushing outperformance compared to 194% for the S&P 500. Don’t miss out on the latest top 10 list, available when you join Stock Advisor.
See the 10 stocks »
*Stock Advisor returns as of October 27, 2025
Sean Williams has no position in any of the stocks mentioned. The Motley Fool has no position in any of the stocks mentioned. The Motley Fool has a disclosure policy.
Recommended Articles


