
Australian Dollar steadies despite disappointing Trade Balance data
- Australian Dollar holds ground after the release of domestic Trade Balance data on Thursday.
- Australia’s Trade Surplus narrowed to 1,825M in August, well below expectations of 6,500M and down from 7,310M prior.
- The US Dollar struggles after the federal government shut down on Wednesday.
The Australian Dollar (AUD) maintains its position against the US Dollar (USD) on Thursday, following the release of Trade Balance data. Additionally, the AUD/USD pair moves little as traders adopt caution after the United States (US) government shut down.
Australian Bureau of Statistics reported on Thursday that Australia’s Trade Surplus narrowed to 1,825 million month-over-month (MoM) in August, against 6,500 million expected and 7,310 million in the previous reading. Meanwhile, Exports fell by 7.8% MoM in August from 3.3% seen a month earlier as Gold exports declined after a run of strong months. Imports rose by 3.2% MoM in August, compared to a decline of 1.3% seen in July.
The Reserve Bank of Australia (RBA) decided earlier this week to keep its Official Cash Rate (OCR) unchanged at 3.6% after concluding the September monetary policy meeting. RBA Governor Michele Bullock said at a post-meeting press conference that components of the monthly CPI little higher than expected, and inflation is not running away.
Australian Dollar holds ground as US Dollar remains subdued after government shutdown
- The US Dollar Index (DXY), which measures the value of the US Dollar against six major currencies, is subdued for the fifth consecutive session and trading around 97.70 at the time of writing.
- The US federal government shut down on Wednesday after a deadlocked Congress failed to reach a funding deal. The September US Nonfarm Payrolls (NFP) report will not be released on Friday, as the Labor Department has paused virtually all activity.
- US ADP Employment Change showed on Wednesday that the private sector payrolls declined 32,000 in September and annual pay was up 4.5% on a yearly basis. This figure followed the 3,000 decrease (revised from a 54,000 increase) reported in August and came in below the market expectation of 50,000.
- The latest Job Openings showed the labor market is slowing, yet vacancies rose from 7.21 million to 7.23 million in August. Meanwhile, the hiring rate edged down to 3.2%, the lowest level since June 2024, while layoffs remained at a low level.
- The CME FedWatch Tool suggests that markets are now pricing in nearly a 97% chance of a Fed rate cut in October and a 76% possibility of another reduction in December.
- Bloomberg reported on Wednesday that China’s state-run iron ore buyer, China Mineral Resources Group (CMRG), directed steelmakers to stop new purchases from Australian mining giant BHP. The news came as China entered its October 1–8 holiday period. However, the Australian Financial Review cited a Chinese commodity pricing firm, Mysteel disputed the report, saying it had “verified through relevant channels and confirmed that this rumour is not true.”
- China’s NBS Manufacturing PMI improved to 49.8 in September, following August’s 49.4. The reading came in above the market consensus of 49.6 in the reported month. The NBS Non-Manufacturing PMI inched lower to 50.0 in September, from August’s 50.3 figure and missed the expectations of 50.3.
- The White House announced that Australian Prime Minister Anthony Albanese and US President Donald Trump will hold their first in-person meeting in Washington, D.C. on October 20 to discuss the Aukus nuclear submarine pact.
- Australia’s AiG Industry Index rose 7.6 points to -13.2 in September, showing slight improvement but remaining in contraction. The S&P Global Manufacturing Purchasing Managers’ Index (PMI) fell to 51.4 in September from 53.0 in August, indicating that the sector continued to expand but at a slower pace.
Australian Dollar remains above 0.6600, nine-day EMA support
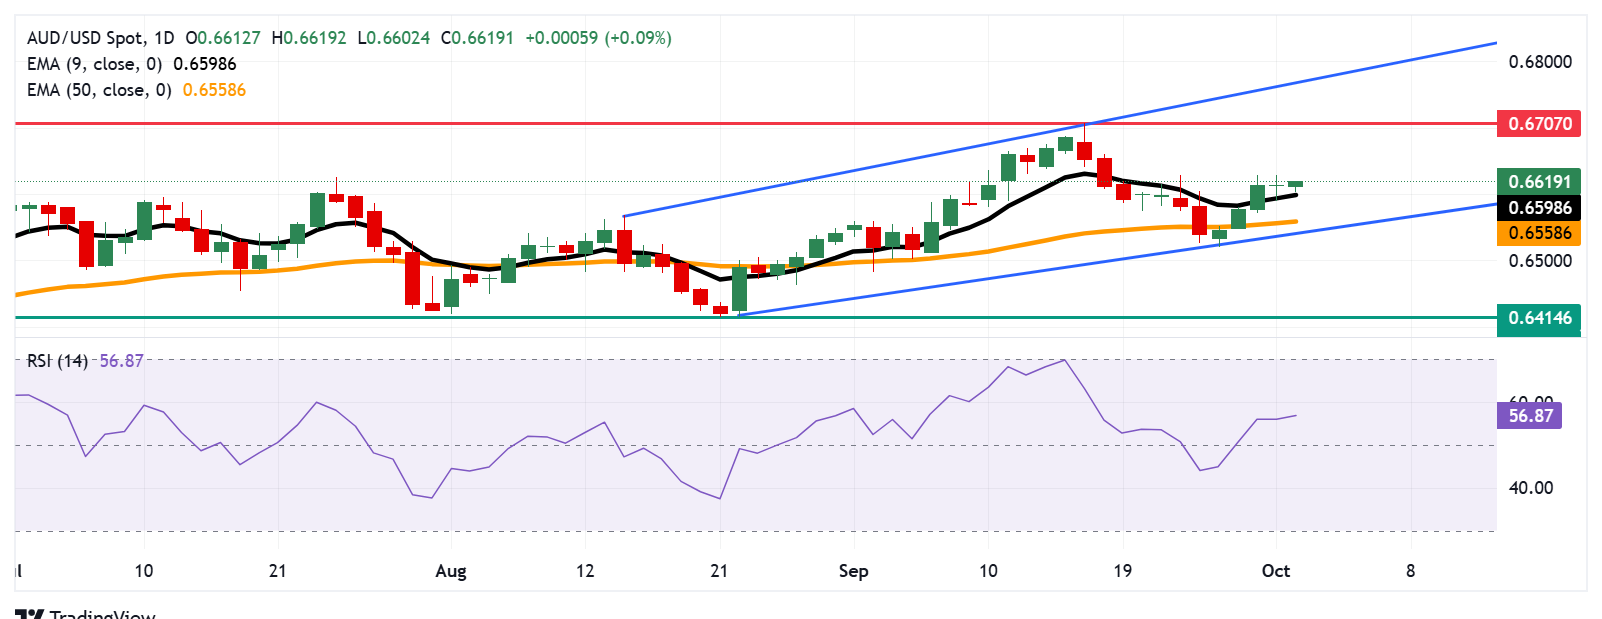
The AUD/USD pair is trading around 0.6620 on Thursday. Technical analysis on the daily chart shows that the pair remains within the ascending channel, indicating a prevailing bullish bias. Additionally, the 14-day Relative Strength Index (RSI) is positioned above the 50 level, strengthening the bullish bias.
On the upside, the AUD/USD pair may explore the region around the 12-month high of 0.6707, recorded on September 17, followed by the upper boundary of the ascending channel around 0.6760.
The initial support appears at the nine-day Exponential Moving Average (EMA) of 0.6598, followed by the 50-day EMA at 0.6558 and the ascending channel’s lower boundary around 0.6540. Further declines below the channel would cause the emergence of the bearish bias and prompt the AUD/USD pair to navigate the region around the fourth-month low of 0.6414, recorded on August 21.
AUD/USD: Daily Chart
Australian Dollar Price Today
The table below shows the percentage change of Australian Dollar (AUD) against listed major currencies today. Australian Dollar was the strongest against the Canadian Dollar.
| USD | EUR | GBP | JPY | CAD | AUD | NZD | CHF | |
|---|---|---|---|---|---|---|---|---|
| USD | -0.07% | -0.05% | -0.06% | 0.00% | -0.12% | -0.42% | -0.11% | |
| EUR | 0.07% | 0.01% | 0.00% | 0.07% | -0.06% | -0.23% | -0.06% | |
| GBP | 0.05% | -0.01% | 0.02% | 0.02% | -0.04% | -0.24% | -0.05% | |
| JPY | 0.06% | 0.00% | -0.02% | 0.05% | -0.07% | -0.46% | -0.02% | |
| CAD | -0.01% | -0.07% | -0.02% | -0.05% | -0.14% | -0.28% | -0.11% | |
| AUD | 0.12% | 0.06% | 0.04% | 0.07% | 0.14% | -0.24% | 0.01% | |
| NZD | 0.42% | 0.23% | 0.24% | 0.46% | 0.28% | 0.24% | 0.35% | |
| CHF | 0.11% | 0.06% | 0.05% | 0.02% | 0.11% | -0.01% | -0.35% |
The heat map shows percentage changes of major currencies against each other. The base currency is picked from the left column, while the quote currency is picked from the top row. For example, if you pick the Australian Dollar from the left column and move along the horizontal line to the US Dollar, the percentage change displayed in the box will represent AUD (base)/USD (quote).
Economic Indicator
Trade Balance (MoM)
The trade balance released by the Australian Bureau of Statistics is the difference in the value of its imports and exports of Australian goods. Export data can give an important reflection of Australian growth, while imports provide an indication of domestic demand. Trade Balance gives an early indication of the net export performance. If a steady demand in exchange for Australian exports is seen, that would turn into a positive growth in the trade balance, and that should be positive for the AUD.
Read more.Last release: Thu Oct 02, 2025 01:30
Frequency: Monthly
Actual: 1,825M
Consensus: 6,500M
Previous: 7,310M
Source: Australian Bureau of Statistics
Recommended Articles


