

What to expect from Ethereum in October 2025

- Trump's Account May Contain BTC. US President Proposes Another Bitcoin Policy, Just Another Political Talk Show?
- Gold declines as Trump scraps Iran memorandum, markets await Fed minutes
- US President Trump: I think MoU with Iran is over
- Gold slides back closer to $4,050 as Iran risks and Fed hike bets boost USD
- WTI Crude Oil Price Forecast: US-Iran Conflict Reignites, Will a New Round of Oil Price Rises Begin?
- Gold recovers above $4,100 as traders assess US-Iran conflict

Leading altcoin Ethereum trended sideways in early September as the market attempted to recover from August’s steep correction. However, bears gained the upper hand on September 12 and have since forced ETH into a downtrend. ETH trades at $4,113 at press time, down nearly 15% since then.
With broader sentiment worsening, user demand falling across the Ethereum network, and institutional investors pulling back, the coin faces mounting headwinds in October.
ETH Supply Climbs as Demand Fades
On-chain data shows Ethereum’s circulating supply has surged over the past month. According to data from Ultrasoundmoney, 76,488.71 ETH has been added to the coins available to the public.
For token TA and market updates: Want more token insights like this? Sign up for Editor Harsh Notariya’s Daily Crypto Newsletter here.
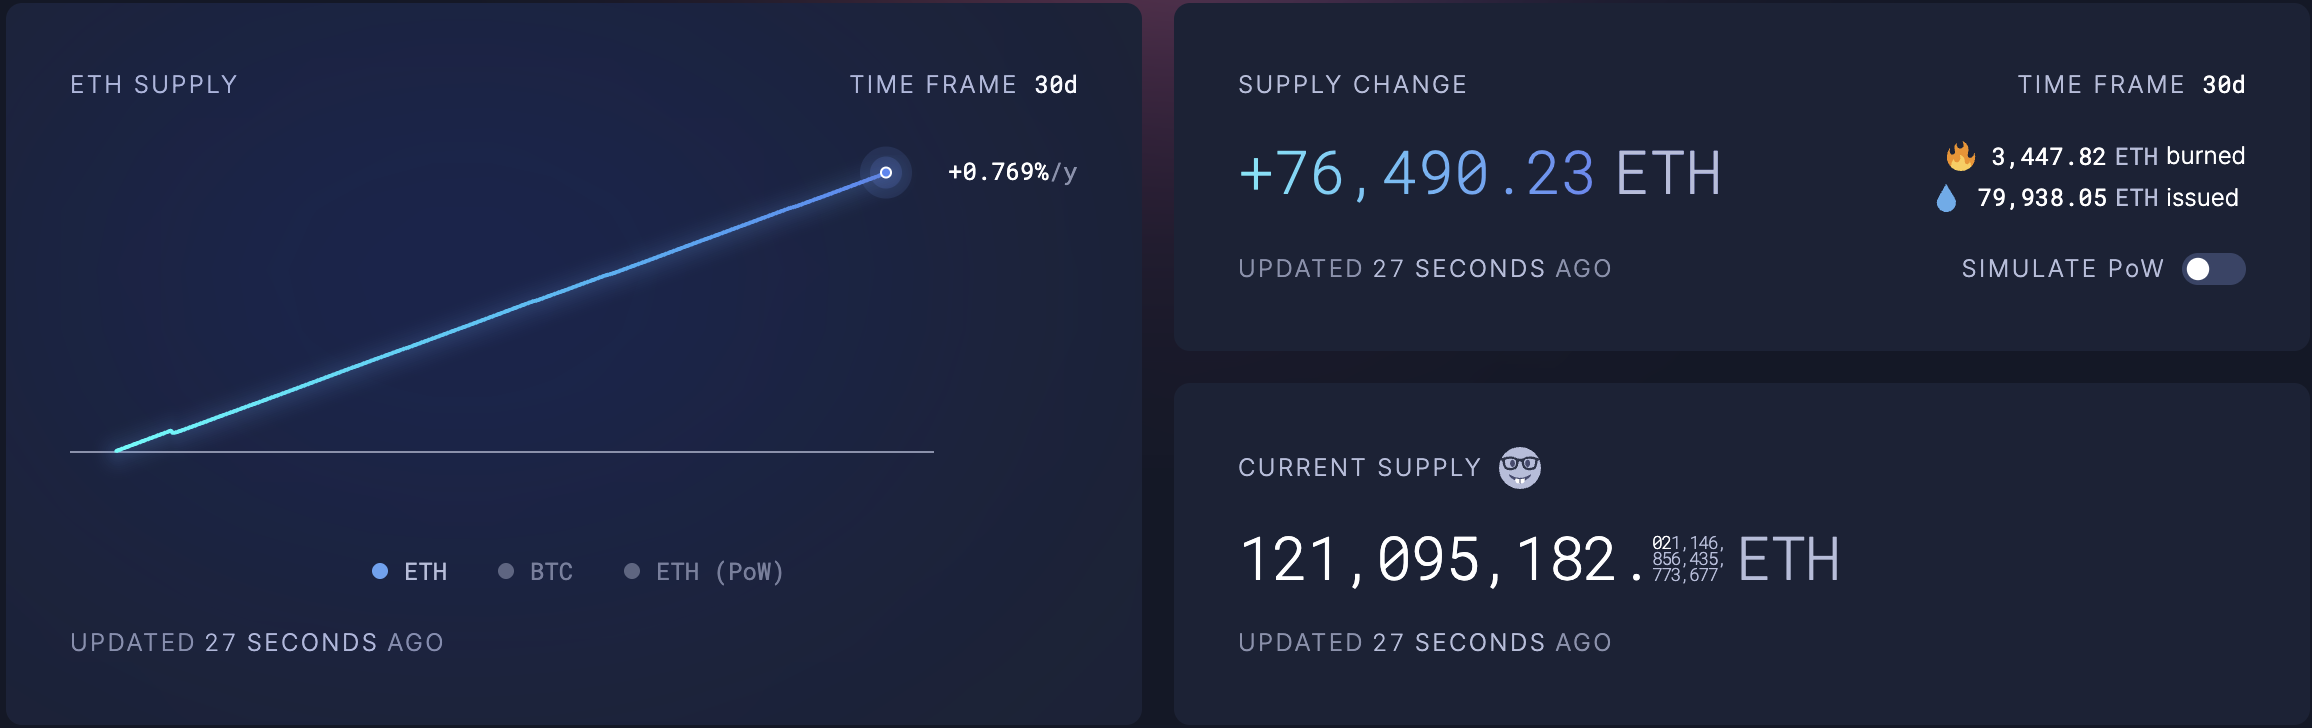
Ethereum’s circulating supply increases when user activity declines, as this reduces the burn rate on the Layer-1 blockchain.
Generally, as more users transact and engage with Ethereum, the burn rate (a measure of ETH tokens permanently removed from circulation) increases, contributing to Ether’s deflationary supply dynamic.
However, with a drop in user activity on the network, its burn rate also plummets, leaving many coins in circulation and adding to its circulating supply.
With ETH facing a climbing bearish bias and no matching demand to absorb the growing supply, downside pressure on ETH strengthens.
Spot ETH ETFs Record Sharp Outflows
The declining institutional appetite for ETH also points to a bearish outlook heading into October. According to Sosovalue, outflows from ETH-focused funds have reached $389 million this month, the largest monthly capital exit since March.
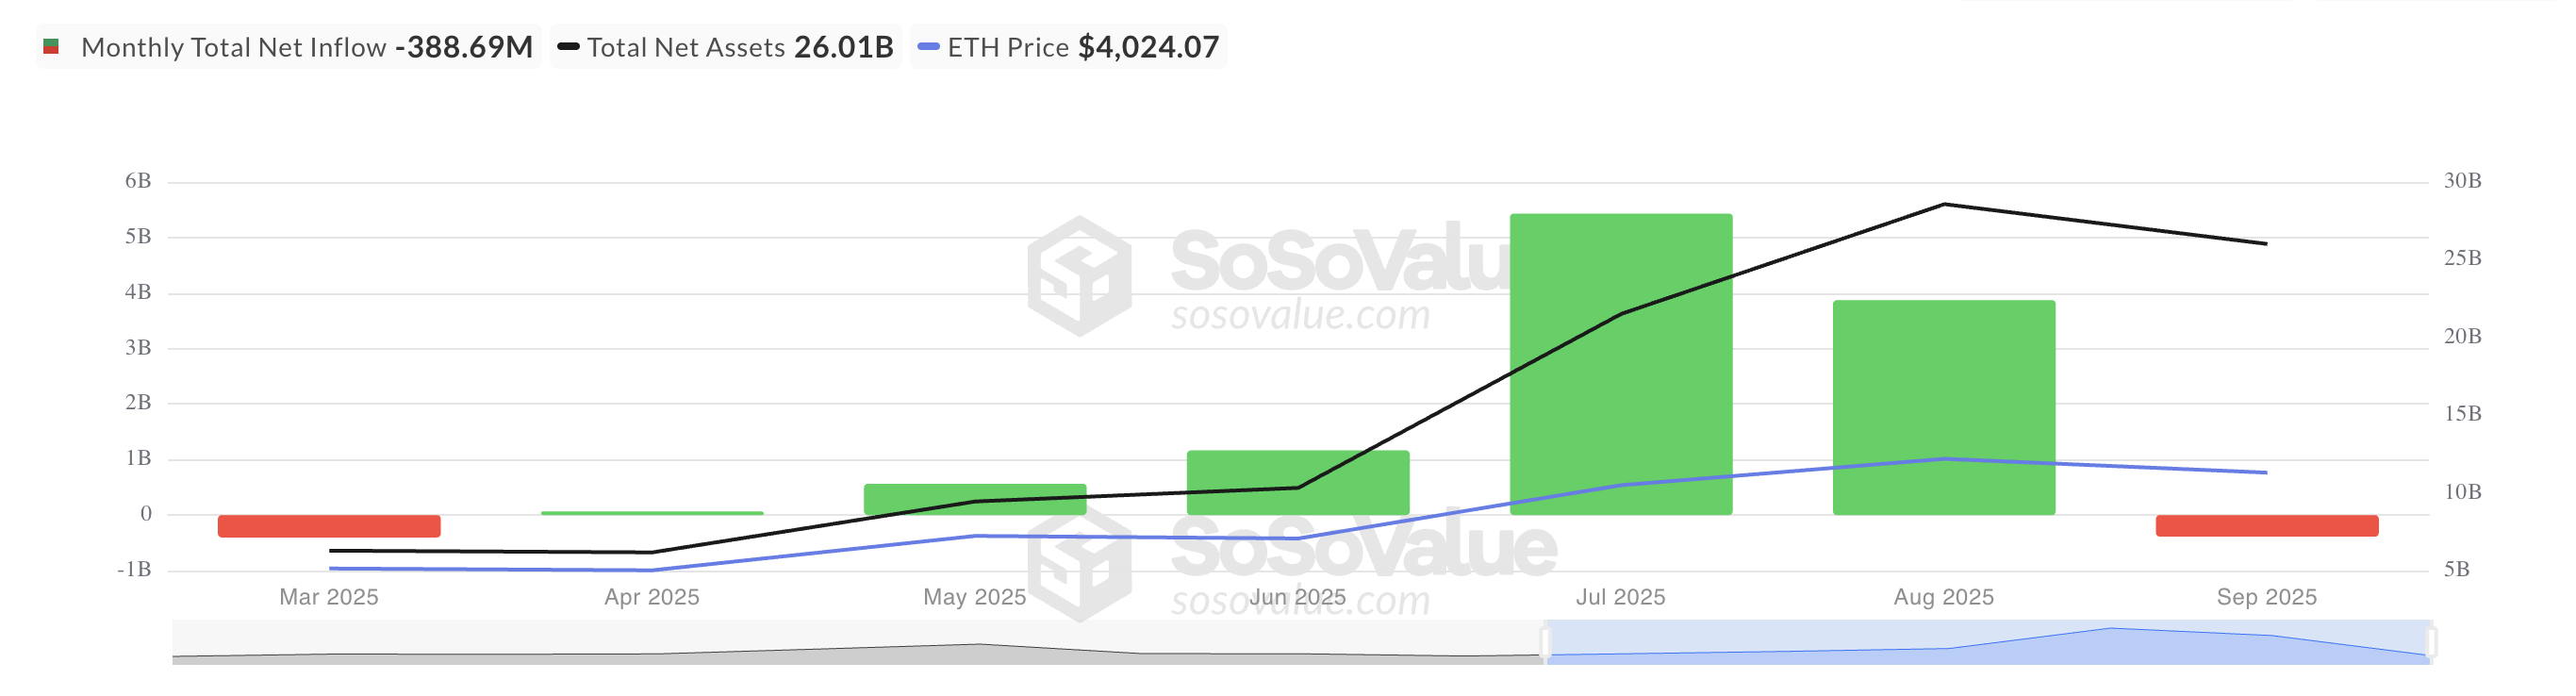
This matters because ETH’s price has strongly correlated with ETF inflows. So when these inflows dip, it signals waning conviction among institutional players. If this trend continues unabated, it could affect the coin’s price performance over the coming weeks.
A lack of institutional interest could also weigh on retail participation. Without the confidence and liquidity that larger players bring, retail investors may refuse to take positions or commit capital, worsening ETH’s performance in the weeks ahead.
Weak Spot Demand Threatens $4,000 Support
Readings from the ETH/USD one-day chart confirm that spot market participation is also weakening. Its On-Balance Volume (OBV) indicator has trended downward since September 12, signaling falling buyer demand.
The OBV tracks cumulative trading volume by adding volume on up days and subtracting it on down days. When the OBV rises, buyers are driving prices higher with strong volume support.
Conversely, a declining OBV like ETH’s suggests that selling pressure outweighs buying activity. This amplifies the downside risks for ETH’s price in the coming month.
If buy-side pressure continues to fade, the altcoin could plunge back below $4,000 and fall toward $3,875.
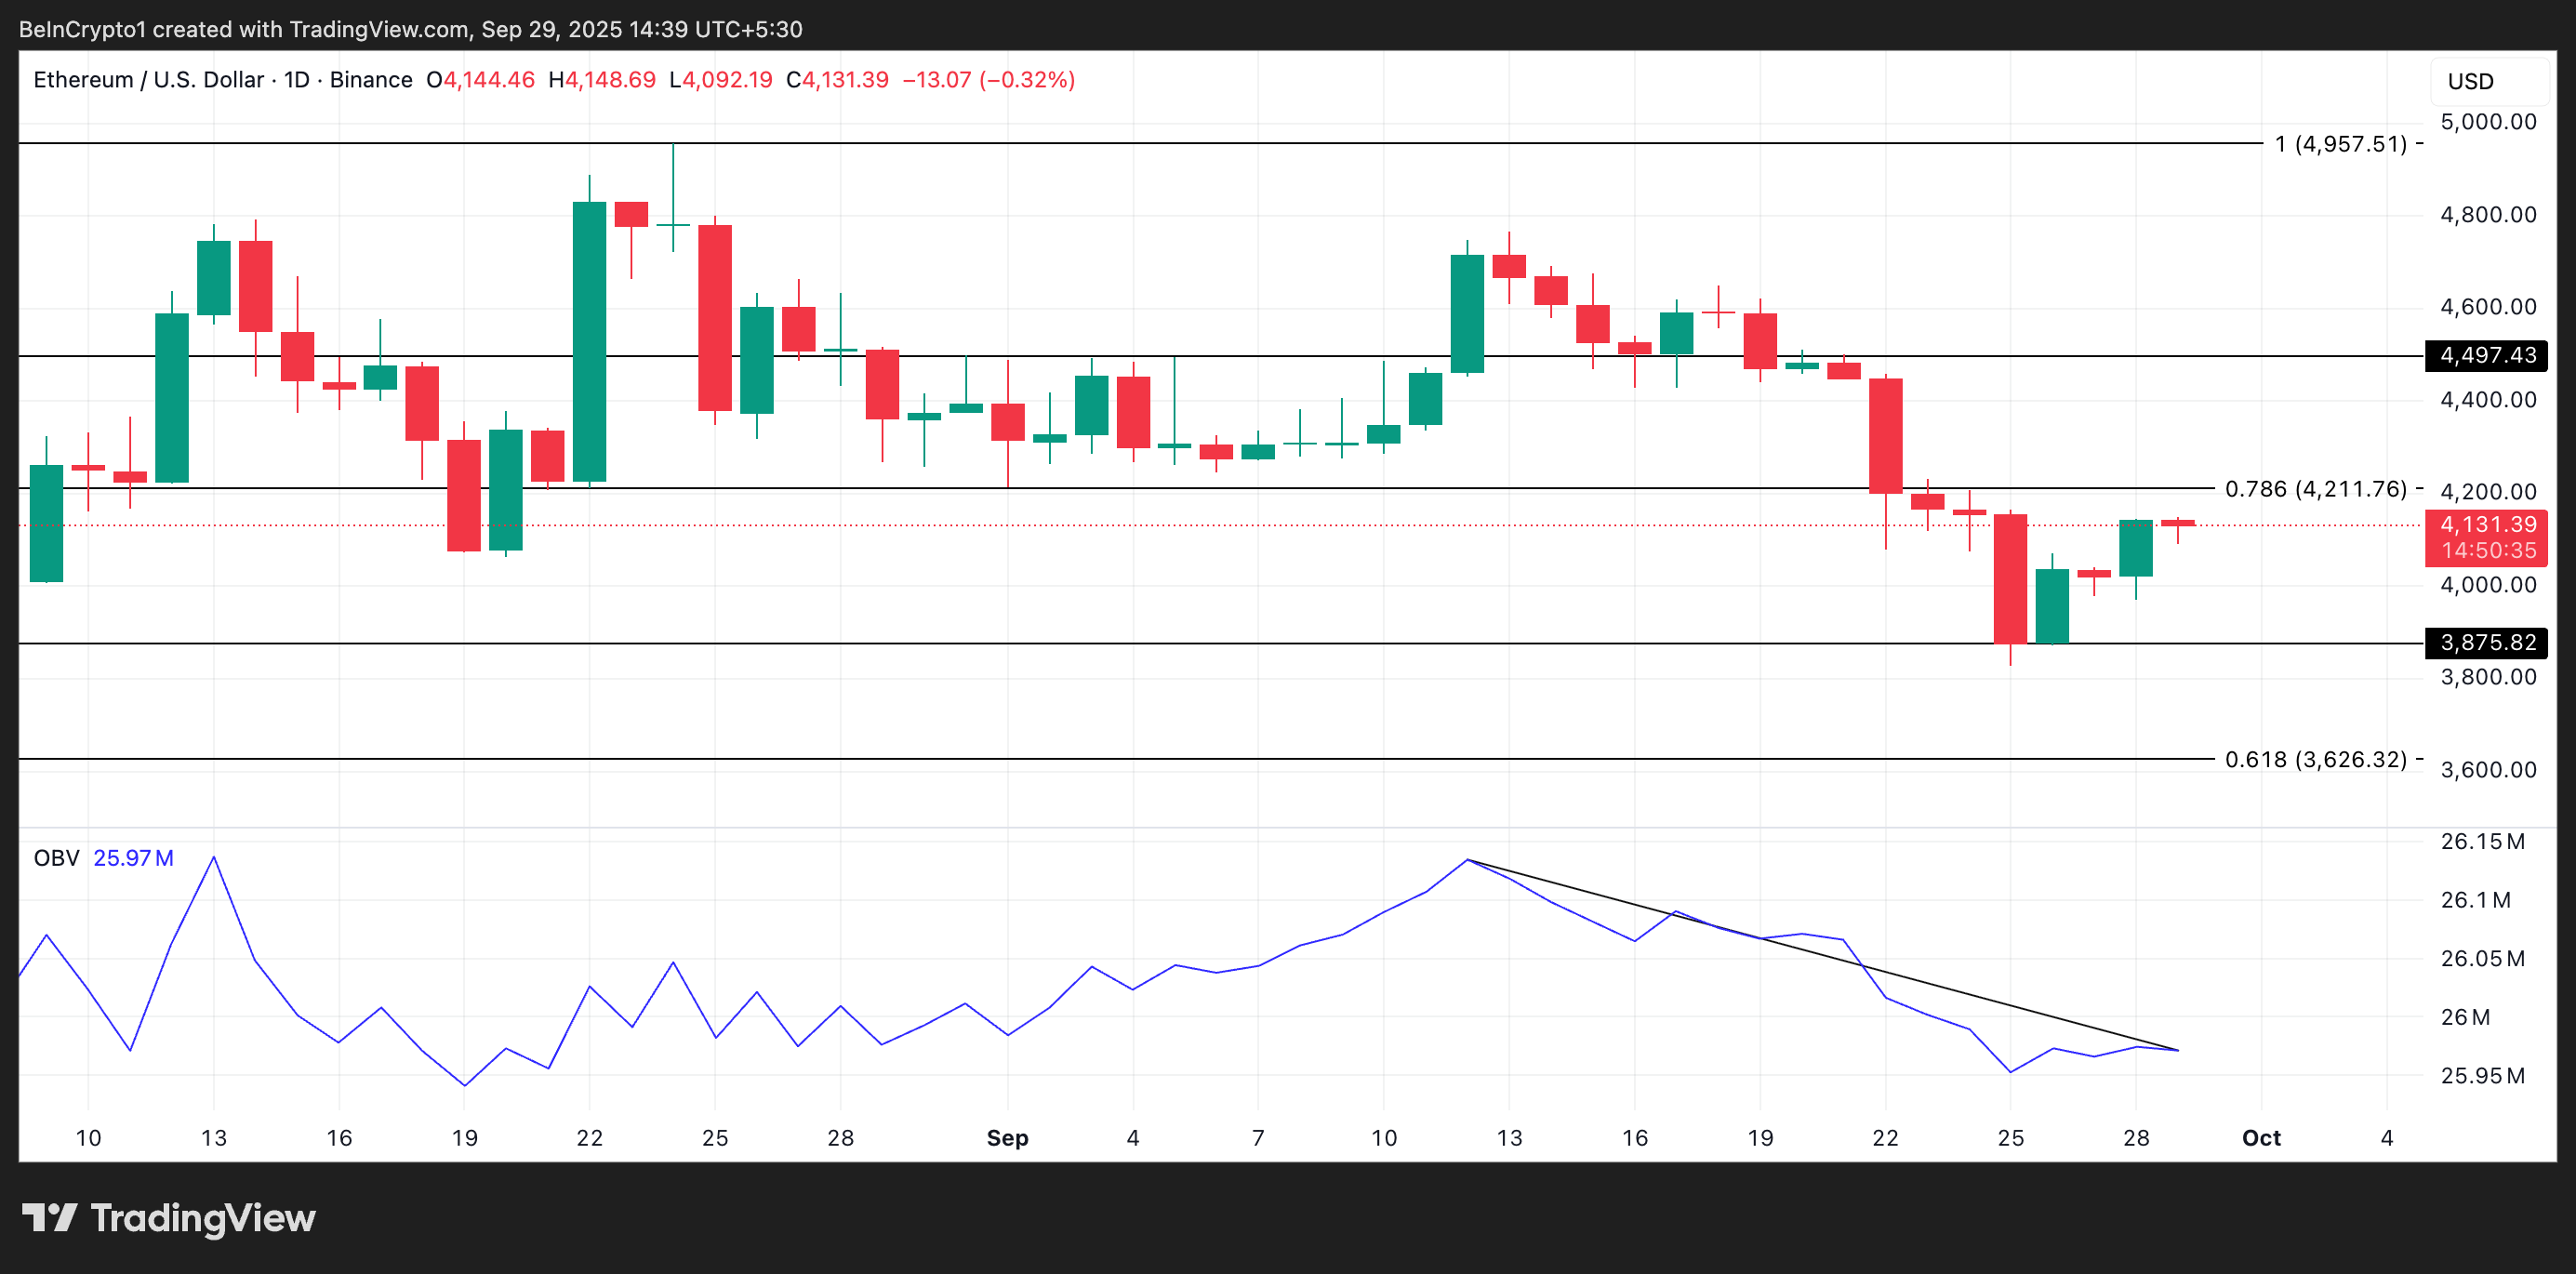
On the other hand, if sentiment improves and demand surges, ETH’s price could gain some strength, breach resistance at $4,211, and climb to $4,497.
Read more
* The content presented above, whether from a third party or not, is considered as general advice only. This article should not be construed as containing investment advice, investment recommendations, an offer of or solicitation for any transactions in financial instruments.


