

Meme Coins Price Prediction: Dogecoin, Shiba Inu, Pepe struggle to gain traction

- Gold Price Trend Forecast: Expectations of Easing US-Iran Tensions Boost Gold Prices, $4,070 Becomes Key Level for Bulls and Bears
- Gold Price Trend Forecast: Why Did Gold Prices Fall After US CPI Cooled? Fed Chair Speech and Iran Situation Become Obstacles
- TradingKey Daily Market Brief: Gold Falls Below $4,000, TSMC’s Strong Earnings Fail to Stop AI Trade Cooling, Chip Stocks Sold Off
- Gold Price Forecast: Cooling Inflation Fails to Offset Fed Hawkish Pressure, Gold Price May Fall to $3,500
- Euro declines to near 1.1400 as US launches fresh strikes on Iran
- Tesla Q2 Earnings Preview: Record Deliveries Fail to Hide Profit Pressure, Can Musk Rely on AI and Autonomous Driving to Unlock New Growth Space?
Dogecoin's short-term recovery faces dynamic resistance on the 4-hour chart.
Shiba Inu reverses from a crucial resistance, extending the consolidation phase.
Pepe tests a support floor as bearish momentum holds.
Meme coins such as Dogecoin (DOGE), Shiba Inu (SHIB), and Pepe (PEPE) remain muted as the broader cryptocurrency market recovers. Dogecoin holds steady ahead of the Exchange Traded Fund (ETF) decision by the US Securities and Exchange Commission (SEC), while Shiba Inu and Pepe hang at crucial support levels.
Dogecoin holds steady ahead of ETF decisions
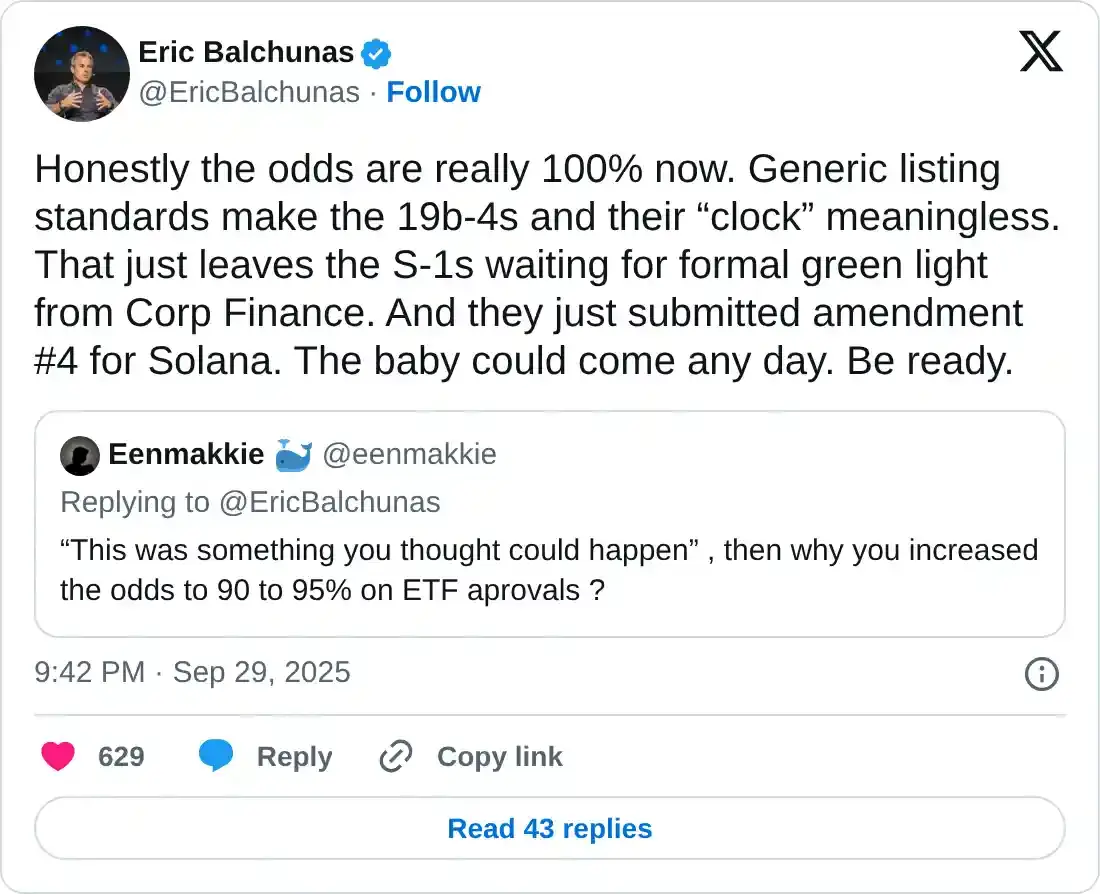
The US SEC requested that Dogecoin and other ETF issuers withdraw their 19b-4 applications on Monday, following the approval of a generic listing standard, as previously reported by FXStreet. Bloomberg ETF analyst Eric Balchunas noted on his X account on Monday that “the odds are really 100% now.”
Amid rising heat around ETFs, Dogecoin faces opposition from the 50-period Exponential Moving Average (EMA) on the 4-hour chart. At the time of writing, DOGE is down by nearly 1% on Tuesday.
Dogecoin’s reversal from the dynamic resistance risks a potential retest of the $0.22046 low from Thursday.
The momentum indicators on the same chart flash mixed signals, as the Relative Strength Index (RSI) at 50 indicates a neutral trend. Meanwhile, the Moving Average Convergence Divergence (MACD) with its signal line continues to rise steadily toward the zero line.
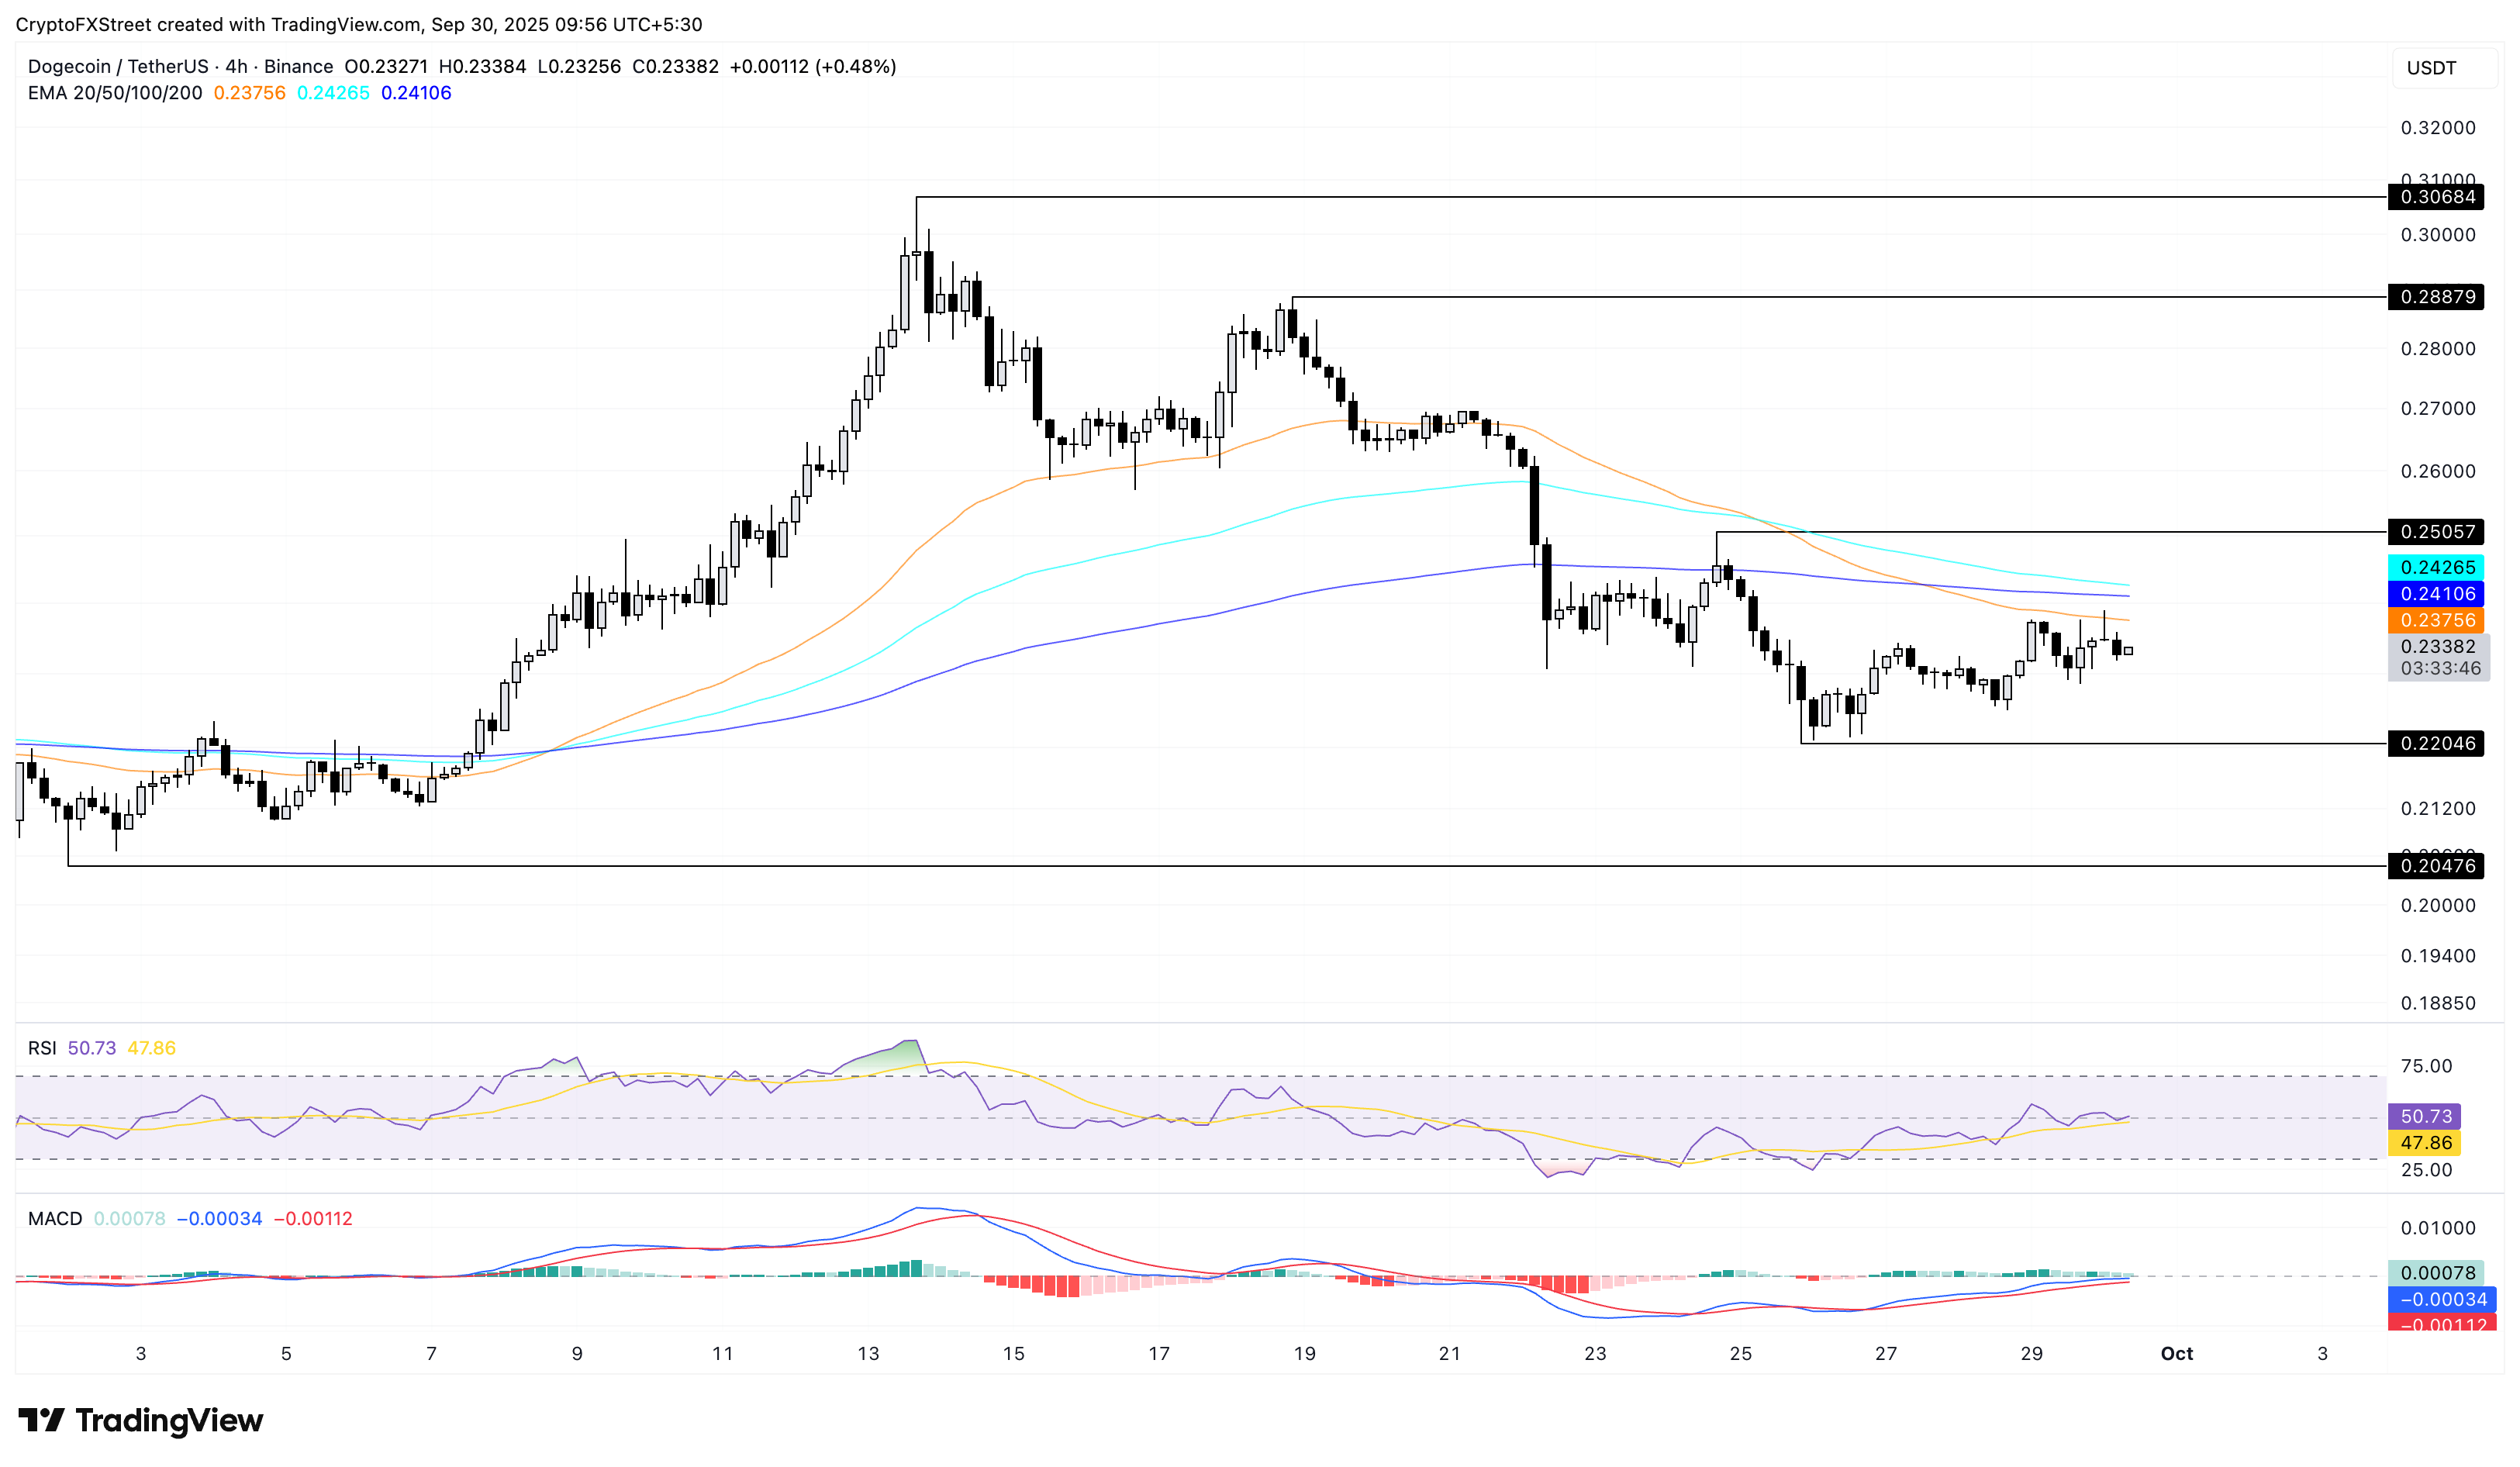
DOGE/USDT 4-hour price chart.
If DOGE exceeds the 200-period EMA at $0.24106, it could face opposition at the $0.25057 high from Wednesday.
Shiba Inu extends its movement within a range
Shiba Inu edges lower by over 1% at press time on Tuesday, starting a downcycle within a consolidation range on the 4-hour chart. This range extends from the $0.00001202 upper boundary to the $0.00001148 support floor.
If the downtrend within the range extends, SHIB would test the $0.00001148 low from Thursday. However, a decisive close below this level would confirm the downside breakout of the range, which could extend the decline to the $0.00001108 low from July 2.
The RSI reads 46 on the same chart, indicating a gradual shift from neutral to bearish in trend momentum. However, the MACD remains above its signal line as it approaches the zero line, suggesting an uptrend in motion. If the MACD crosses below its signal line, it would confirm a bearish shift.
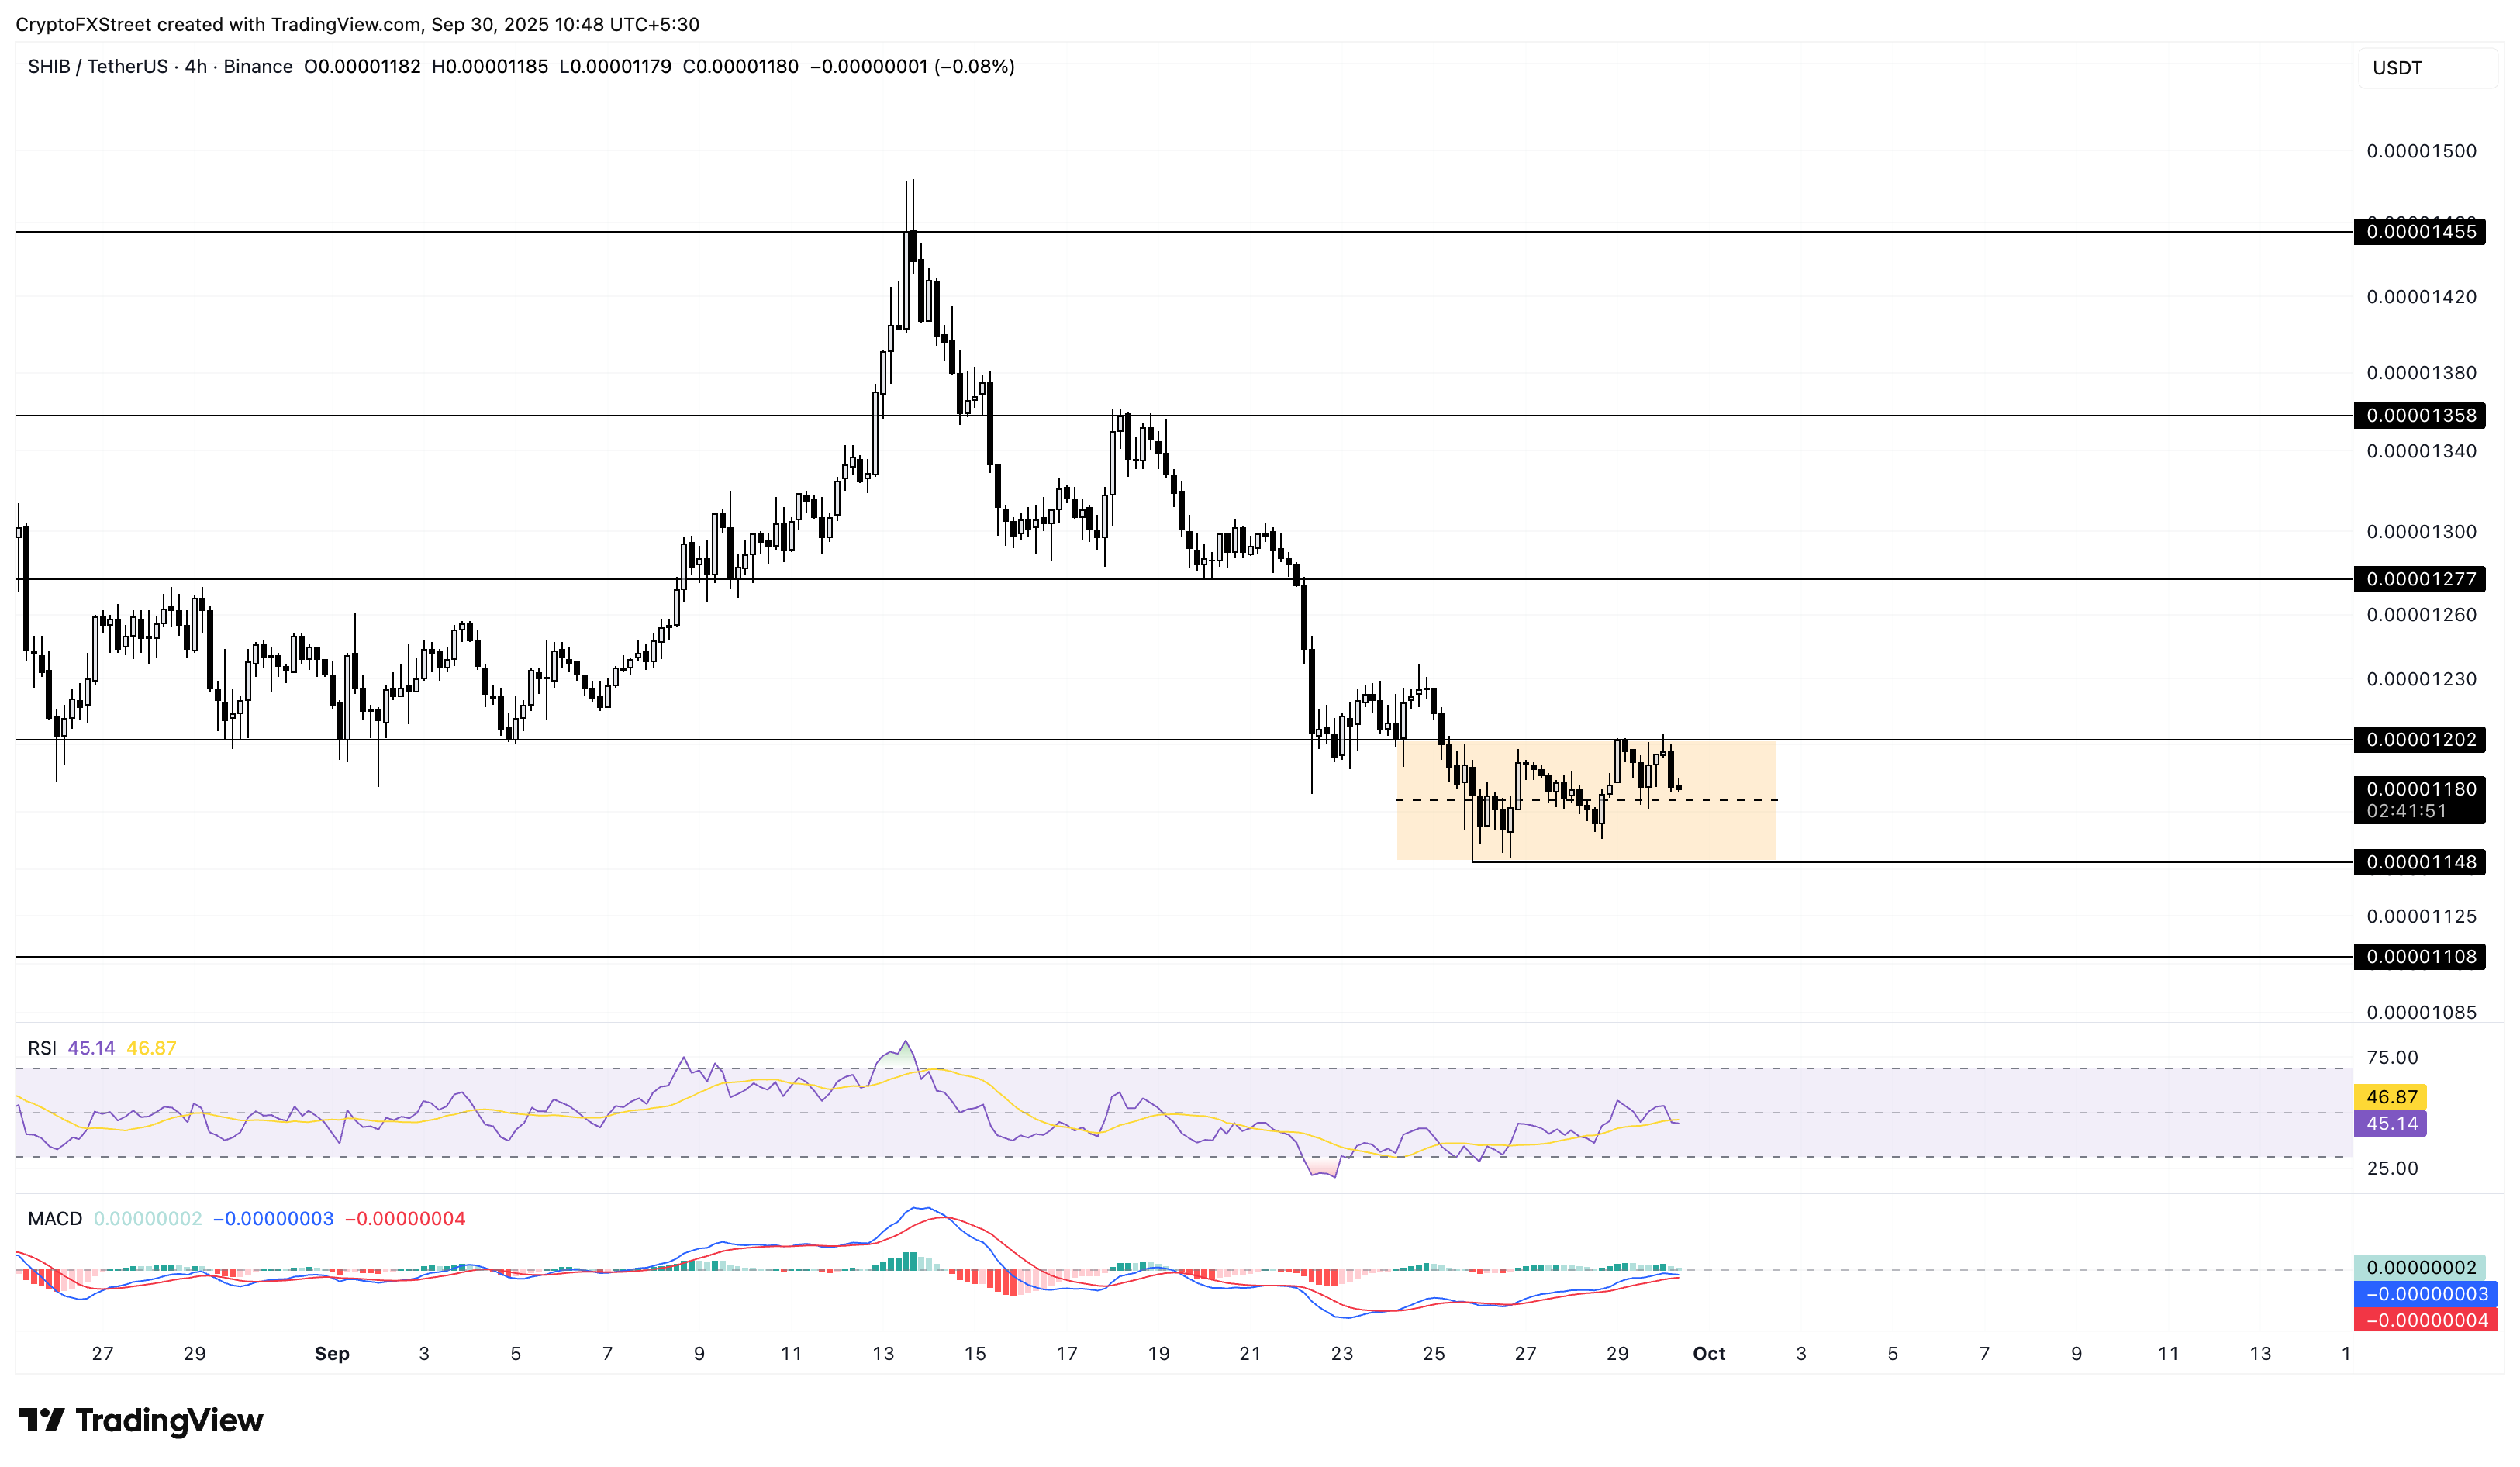
SHIB/USDT 4-hour price chart.
Looking up, if SHIB marks a clean push above $0.00001202 resistance, it could approach the $0.00001277 level last tested as support on Saturday.
Pepe reaches a crucial crossroad
Pepe is down by 1% at the time of writing on Tuesday, extending the minor 0.42% loss from Monday. The intraday pullback inches closer to the $0.00000887 support level, last tested on Thursday.
If PEPE drops below this level, it could nosedive to the $0.00000758 level, marked by the low of May 6.
The RSI at 39 maintains a bearish incline with room for further correction before reaching the oversold zone. Still, the MACD moves closer to its signal line, preparing for a potential crossover, which indicates a loss in bearish momentum.
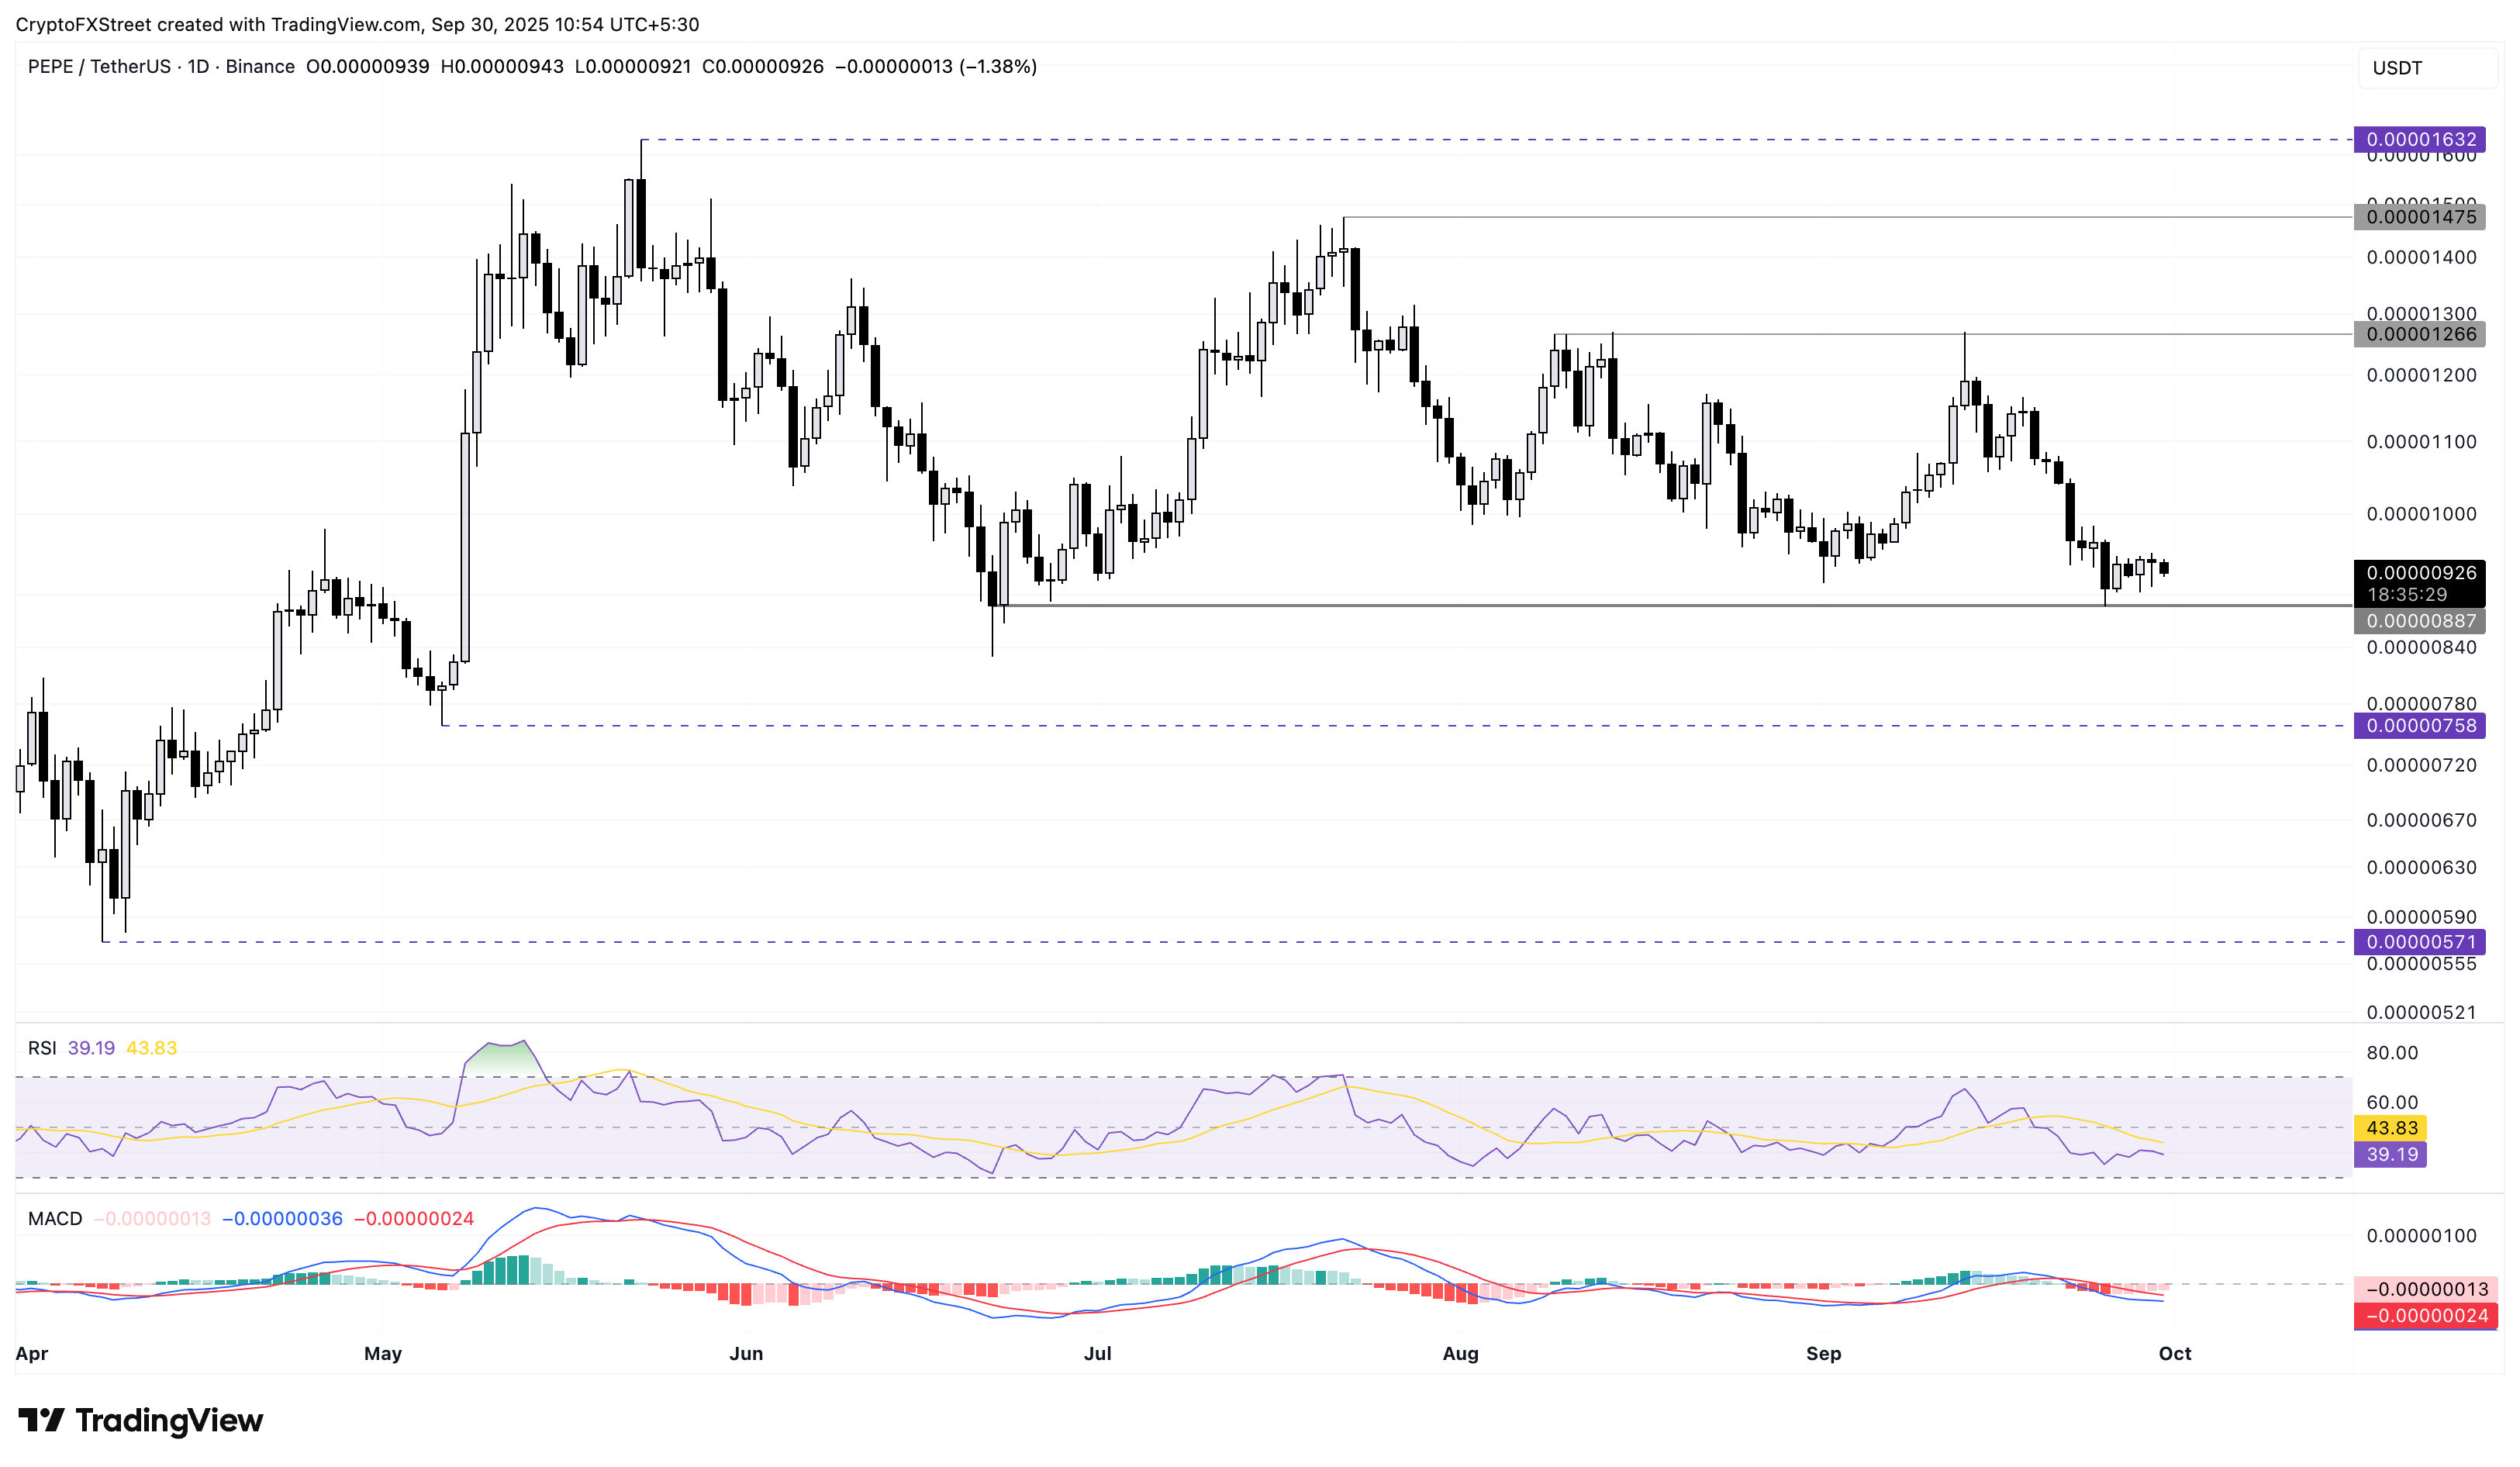
PEPE/USDT daily price chart.
If PEPE rebounds above the $0.00001000 psychological level, it could test the $0.00001266 resistance level, last tested on September 13.
Read more
* The content presented above, whether from a third party or not, is considered as general advice only. This article should not be construed as containing investment advice, investment recommendations, an offer of or solicitation for any transactions in financial instruments.


