

Dogecoin Price Prediction: DOGE stabilizes at $0.25 as PEPE, TRUMP near double-digit losses
- Dogecoin price holds firmly above the $0.25 level on Wednesday, buoyed by institutional interest and ETF speculations.
- Bloomberg analyst hinted Dogecoin ETF is ‘likely’ to be approved and considered a commodity by the US SEC.
- Dogecoin Age Consumed remains flatlined at 19 billion, down 90% from February 3 peaks, as long-term holders show reluctance to sell.
Dogecoin (DOGE) price holds firmly above the $0.25 level on Wednesday, while on-chain data links DOGE’s resilient performance to institutional interest and long-term investors’ reluctance to sell the token amid Exchange Traded Funds (ETFs) speculations.
DOGE shows resilience as crypto market tumble ahead of US CPI data
The global crypto market descended into a sharp correction in the last 24 hours as the United States (US) Bureau of Labor Statistics is set to publish the Consumer Price Index (CPI) inflation data for January.
Annual headline CPI inflation is expected to have remained steady at 2.9%, while core CPI inflation – which excludes volatile food and energy prices – to have grown at a slower pace of 3.1%, compared to a 3.2% increase in December. On a monthly basis, both headline and core CPI are expected to have risen by 0.3%.
Sticky inflation data would suggest that the Fed should keep interest rates higher for longer, thus benefiting the US Dollar (USD) and weighting on risky assets, like cryptocurrencies.
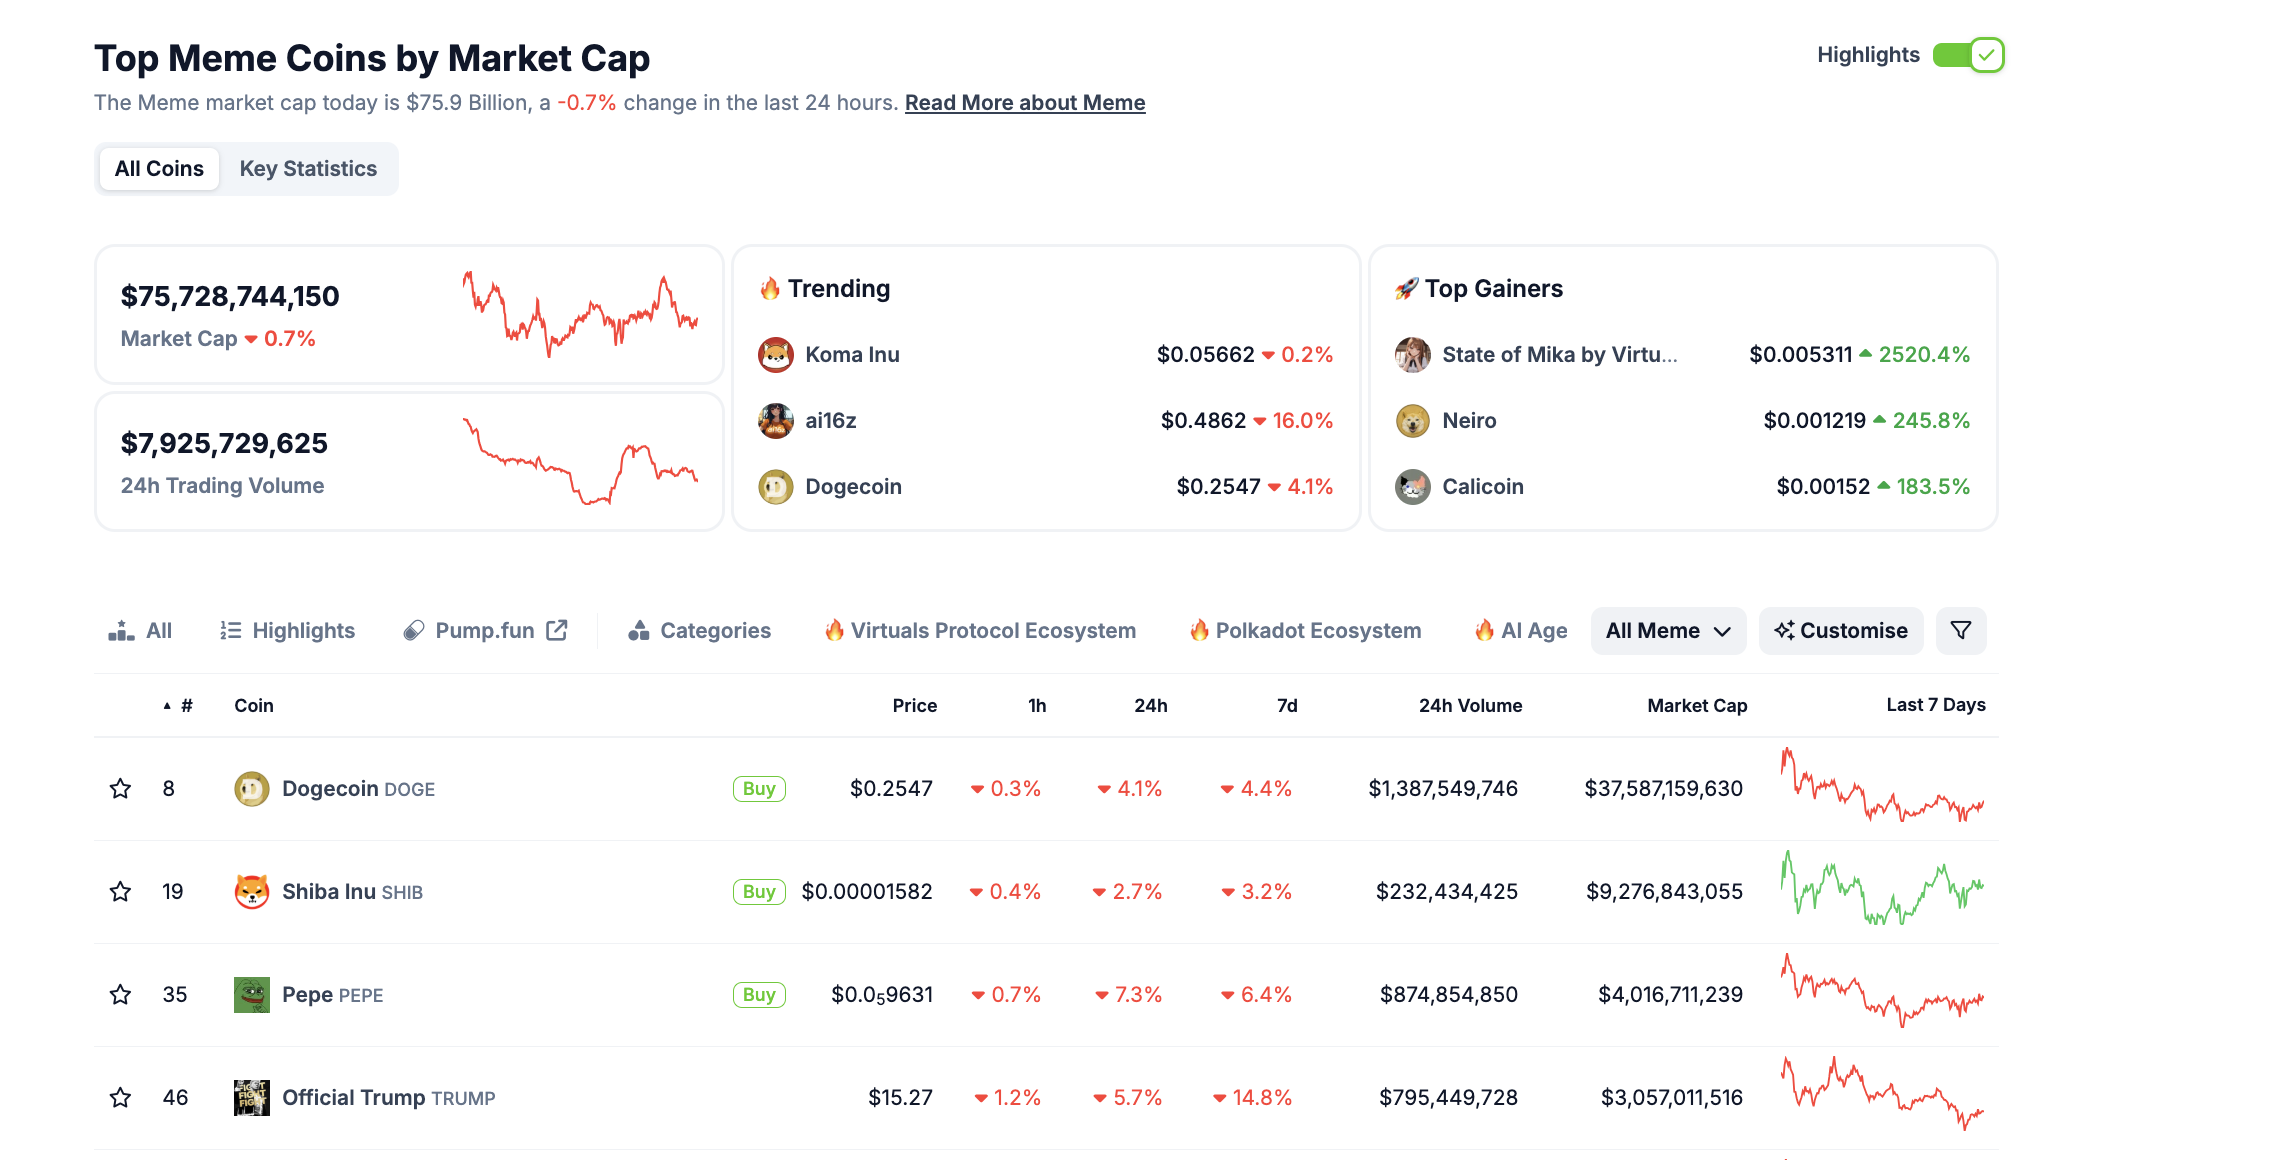 Global memecoin sector performance, February 12 | Coingecko
At press time, just hours before the US CPI data release, memecoin markets are down, but a closer look at market performance trends shows DOGE price exhibiting considerably more resilience than its rivals.
Dogecoin price has declined 4% in the last 24 hours, while PEPE and Official TRUMP tokens are nearing double-digit losses, dropping by 7% and 6%, respectively.
Shiba Inu (SHIB), another major memecoin, has also suffered, declining by 2.7% in the past 24 hours and 3.2% over the past seven days.
Despite the downturn, DOGE continues to trade above $0.25, suggesting significant investor confidence amid the ongoing macroeconomic uncertainty.
Dogecoin long-term investors unwilling to sell amid positive ETF speculations
Dogecoin’s relatively resilient performance on Wednesday can be attributed to rising institutional interest after Bloomberg analysts triggered another wave of ETF speculations this week. On Monday, Blockworks’ Founder Jason Yanowitz alerted his 120,000 followers on X to a spreadsheet showing the likelihood of ETF approvals for top altcoins, including Ripple (XRP), Solana (SOL), Dogecoin (DOGE), and Litecoin (LTC).
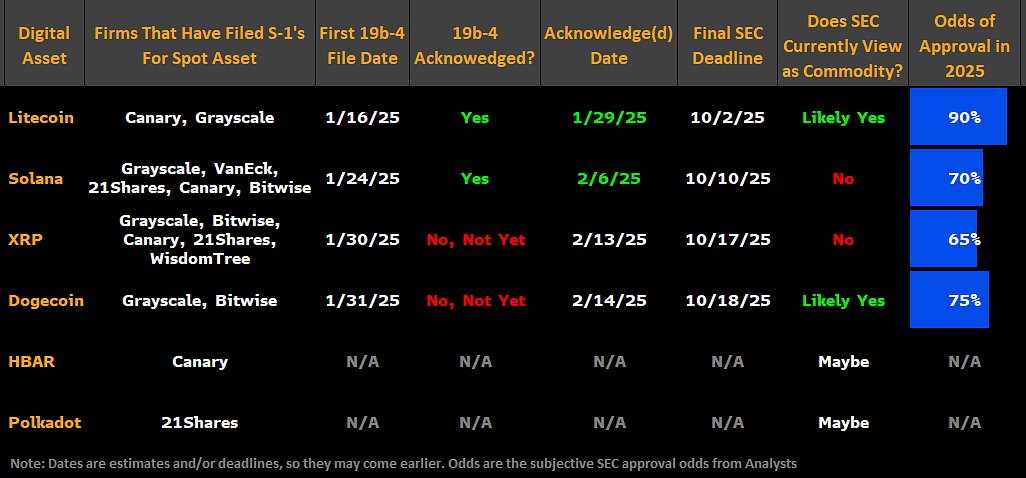
Crypto ETF Filings.
According to speculation, Dogecoin and Litecoin ETFs are likely to be approved as the US Securities and Exchange Commission (SEC) could classify them as commodities, while other altcoins may face additional regulatory hurdles. This event has provided a major boost for DOGE and LTC over the last 48 hours.
Litecoin price surged to a February high of $130 before retracing toward $110 amid the broader market dip.
Dogecoin traders are also reacting positively, keeping the asset above $0.25 despite the overall bearish sentiment in the crypto market.
DOGE long-term holders reluctant to sell
Supporting this bullish outlook, Santiment’s Age Consumed metric, which tracks the volume of tokens traded on a given day multiplied by the number of days since they were last moved, provides instant insights into the buy-sell activities of long-term investors.
A spike in Age Consumed indicates a selling trend among long-term holders, while a decline suggests investor confidence and retention.
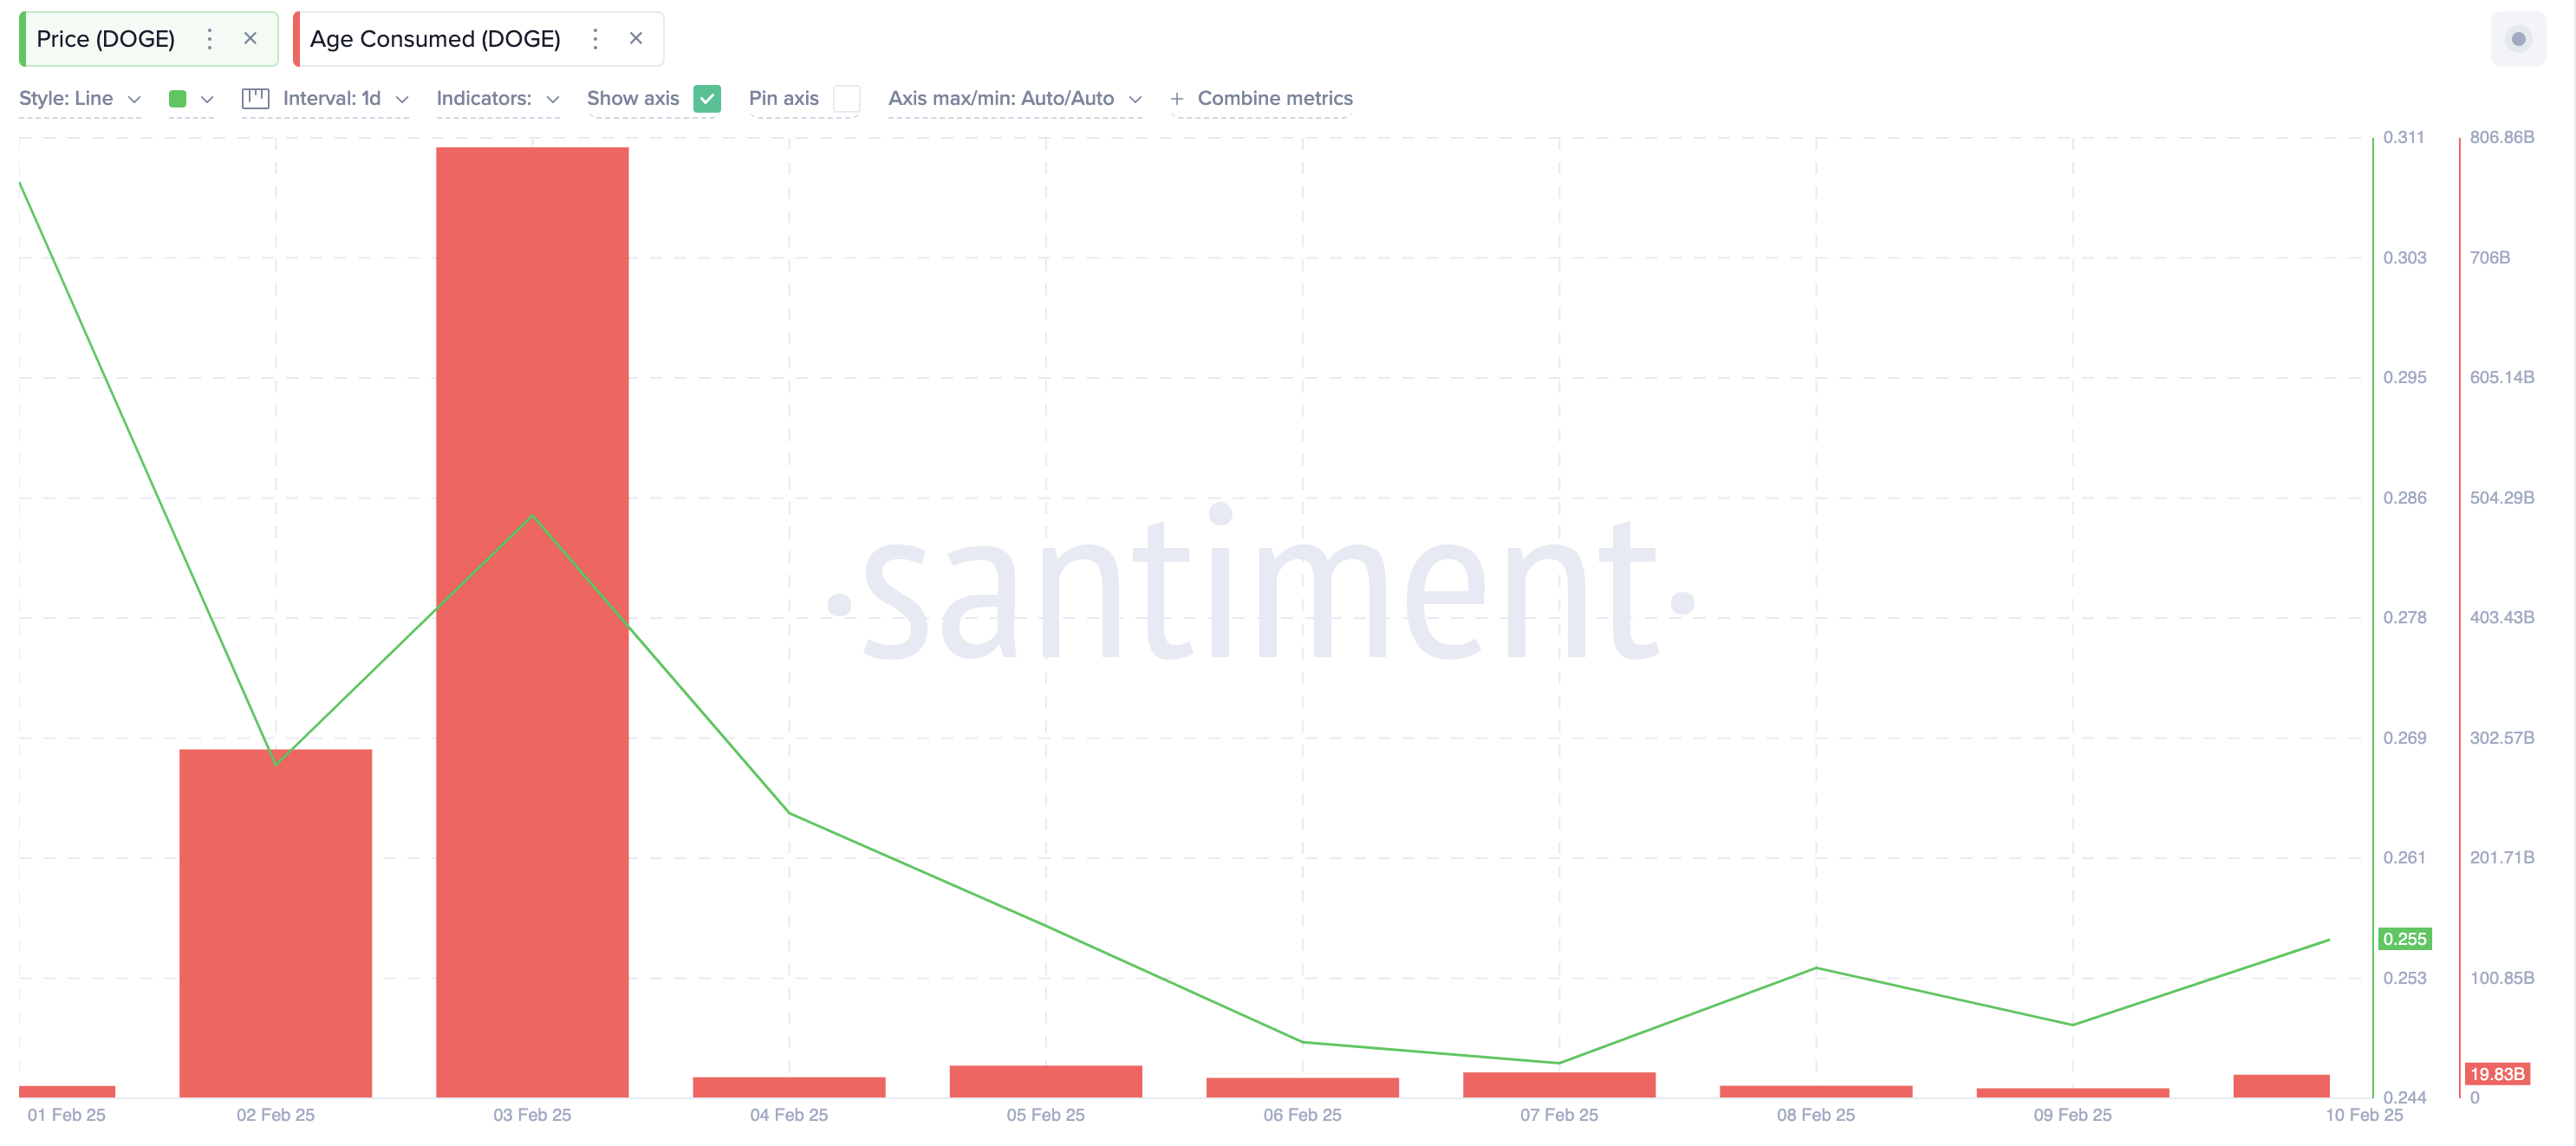 Dogecoin Age Consumed vs. DOGE price | Source: Santiment
The data shows that DOGE’s Age Consumed has remained flatlined at 19.8 billion DOGE since February 4, representing a 90% decline from the February 3 peak of 798.9 billion DOGE.
Why this could be bullish for Dogecoin?
A decline in Age Consumed means fewer long-held coins are being traded, with the majority of long-term investors showing reluctance to sell. This suggests that investors may be positioning themselves for potential ETF approval gains, which explains why DOGE price has held above the $0.25 level while rivals PEPE and TRUMP have booked steeper losses.
The combination of institutional accumulation, ETF optimism, and long-term investor retention has helped Dogecoin outperform other memecoins amid macroeconomic uncertainties. If the speculation around ETF approval continues, DOGE could maintain its price stability or even attempt an upward breakout in the near future.
Dogecoin Price Forecast: $0.25 defense set-up could spark early rebound
Dogecoin price forecast chart suggests an early recovery attempt if bulls successfully defend the $0.25 psychological support level. The daily DOGE/USDT chart reveals a resilient technical setup, with DOGE consolidating within a tight range following a steep decline of 13.46% in three days. The rebound attempt is supported by a minor 4.19% bounce over the last four days, signaling potential accumulation at the lower Bollinger Band near $0.213.
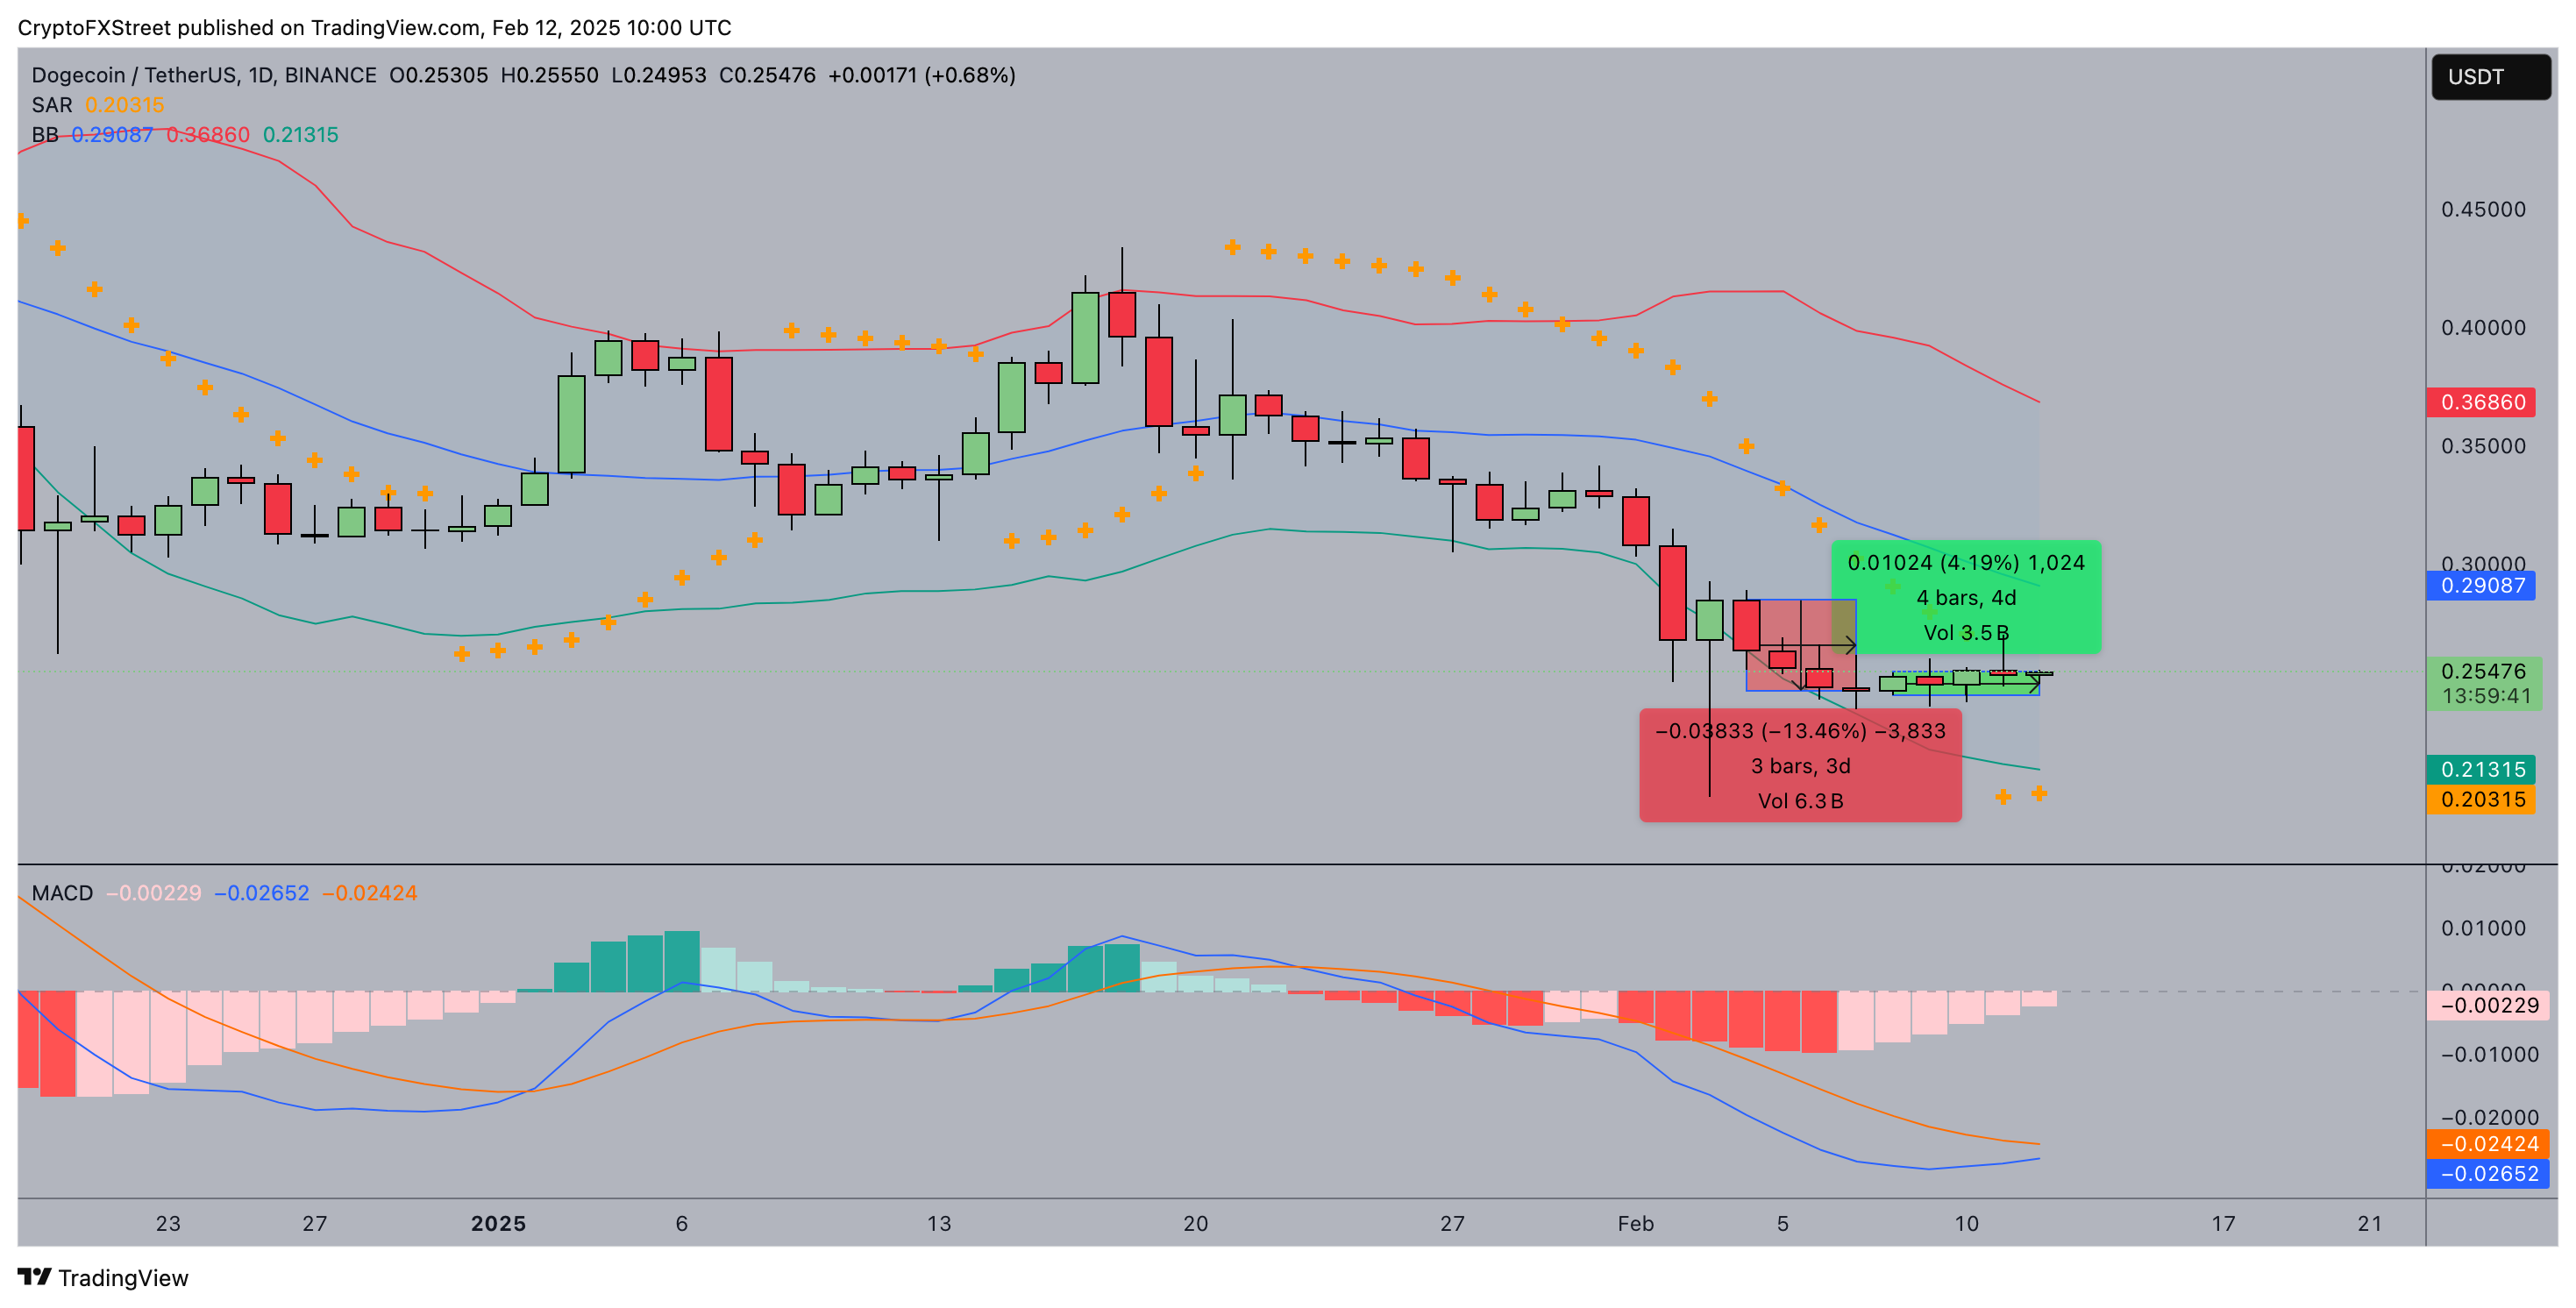 Dogecoin price forecast | DOGE/USDT (Binance)
The Bollinger Bands show compression after an extended downtrend, hinting at an imminent volatility breakout. The middle band at $0.29 aligns with prior resistance, making this level the next major upside target if buyers gain control. The Parabolic SAR dots above the candles indicate a lingering bearish trend, but a flip beneath price action could reinforce a bullish reversal.
The MACD histogram remains in negative territory but shows contracting bearish momentum as the MACD line attempts a crossover with the signal line. If this bullish cross is confirmed, DOGE could retest $0.30. However, failure to hold $0.25 could invite further selling, exposing $0.203 as the next support.
Recommended Articles


