

Dow Jones rebounds above 40,000 as traders brace for mega-cap earnings
- Dow recovers losses as investors await Microsoft, Apple, Meta and Amazon earnings.
- Tariff uncertainty weighs on sentiment; Dallas Fed index plunges to -35.8 in April.
- Gold rises nearly 1% as the US Dollar slumps to a three-day low near 98.87.
The Dow Jones Industrial Average (DJIA) erased earlier losses and rose, posting gains of over 0.13%. Market participants were awaiting earnings reports of four of the seven mega-cap companies, which lowered most US equity indices, including the DJIA. At the time of writing, the DJIA remains above the 40,000 figure despite being down on the day.
DJIA edges up 0.13% despite cautious mood, tariff concerns and mega-cap tech shares under pressure
Sentiment remains sour, as depicted by Wall Street trading with losses. Traders are bracing for the release of Microsoft, Apple, Meta and Amazon's weekly earnings reports. Meanwhile, Amazon shares are falling 2%, Microsoft tumbles over 1%, and Meta and Apple are the least damaged, each down 0.5% and 0.4%, respectively.
Earnings reports have been somewhat strong, but expectations for the second quarter have been lowered amid uncertainty about US trade policies. Earlier, US Treasury Secretary Scott Bessent said that they’re making progress on some trade proposals, but regarding China, he said, “I believe that it’s up to China to de-escalate, because they sell five times more to us than we sell to them, and so these 120%, 145% tariffs are unsustainable.”
On the data front, the Dallas Fed Manufacturing Index plunged from -16.3 to -35.8 in April due to business executives turning pessimistic and blaming the tariff turmoil, according to the Dallas Fed report.
Aside from this, Gold prices remained underpinned by a weak US Dollar (USD), with the yellow metal rising almost 1% to $3,350. The US Dollar Index (DXY), which tracks the performance of a basket of six currencies against the US Dollar, shed 0.62% and is down at 98.87, the lowest level in the last three days.
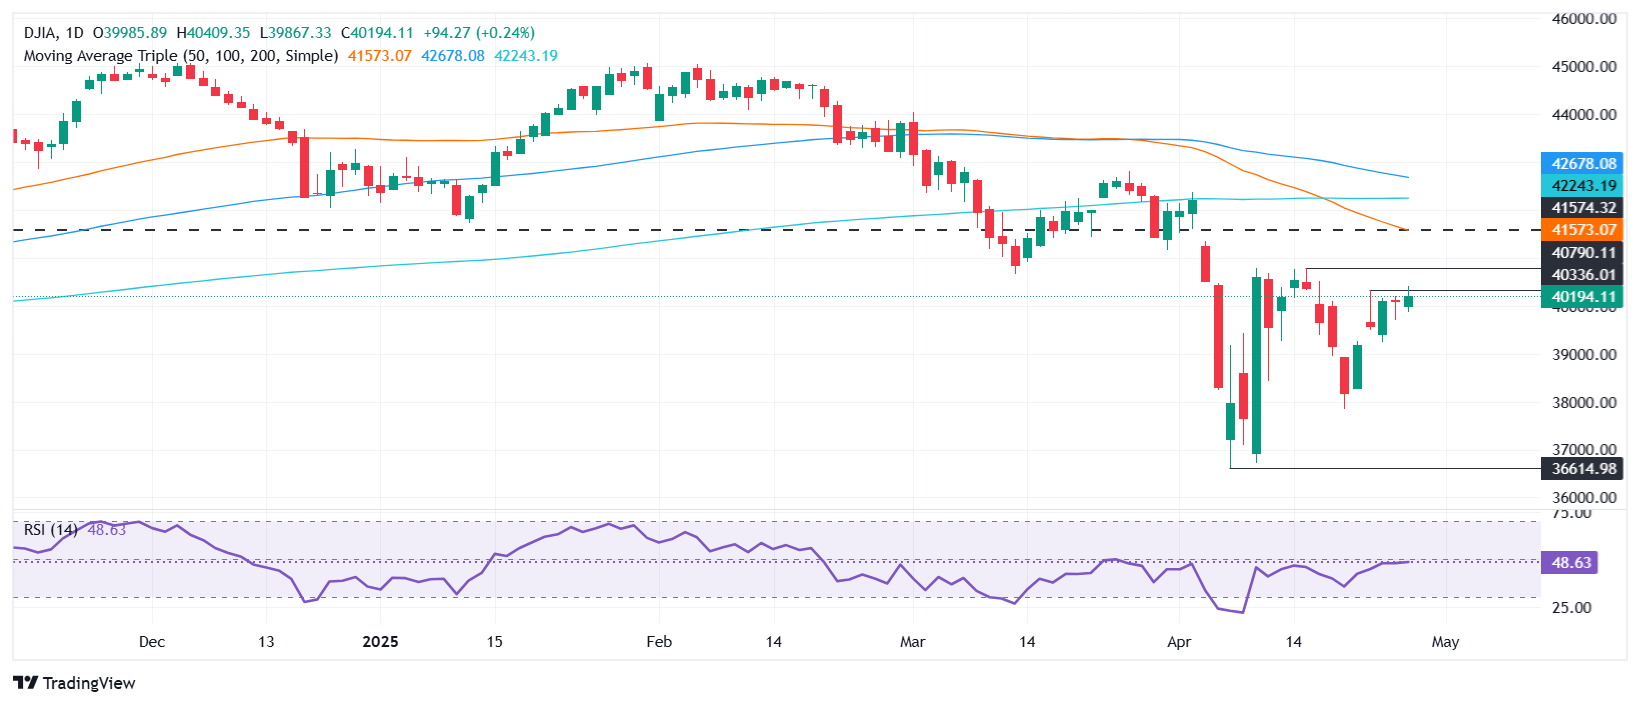
Dow Jones price forecast
The Dow’s bearish bias hasn’t changed even though the index cleared the 20-day Simple Moving Average (SMA) key resistance and turned support at 39,876. Buyers seem to gather some steam as the Relative Strength Index (RSI) approaches its neutral line, but it remains below the 50 level.
If the DJIA clears 40,200, the next key resistance would be 40,500, followed by the 41,000 mark. Overhead key resistance lies at 41,565, where the 50-day SMA lies, followed by the 200-day SMA at 42,273.
On the other hand, the Dow’s falling below 40,000 clears the path to test April 23’s low of 39,486, followed by the April 22 high of 39,271 to close the gap witnessed between April 22 and 23.
Dow Jones FAQs
The Dow Jones Industrial Average, one of the oldest stock market indices in the world, is compiled of the 30 most traded stocks in the US. The index is price-weighted rather than weighted by capitalization. It is calculated by summing the prices of the constituent stocks and dividing them by a factor, currently 0.152. The index was founded by Charles Dow, who also founded the Wall Street Journal. In later years it has been criticized for not being broadly representative enough because it only tracks 30 conglomerates, unlike broader indices such as the S&P 500.
Many different factors drive the Dow Jones Industrial Average (DJIA). The aggregate performance of the component companies revealed in quarterly company earnings reports is the main one. US and global macroeconomic data also contributes as it impacts on investor sentiment. The level of interest rates, set by the Federal Reserve (Fed), also influences the DJIA as it affects the cost of credit, on which many corporations are heavily reliant. Therefore, inflation can be a major driver as well as other metrics which impact the Fed decisions.
Dow Theory is a method for identifying the primary trend of the stock market developed by Charles Dow. A key step is to compare the direction of the Dow Jones Industrial Average (DJIA) and the Dow Jones Transportation Average (DJTA) and only follow trends where both are moving in the same direction. Volume is a confirmatory criteria. The theory uses elements of peak and trough analysis. Dow’s theory posits three trend phases: accumulation, when smart money starts buying or selling; public participation, when the wider public joins in; and distribution, when the smart money exits.
There are a number of ways to trade the DJIA. One is to use ETFs which allow investors to trade the DJIA as a single security, rather than having to buy shares in all 30 constituent companies. A leading example is the SPDR Dow Jones Industrial Average ETF (DIA). DJIA futures contracts enable traders to speculate on the future value of the index and Options provide the right, but not the obligation, to buy or sell the index at a predetermined price in the future. Mutual funds enable investors to buy a share of a diversified portfolio of DJIA stocks thus providing exposure to the overall index.
Recommended Articles


