

Dow Jones Industrial Average falls ahead of fresh tariff threats
- The Dow Jones tumbled back below 42,500 on Wednesday.
- Equities are souring ahead of yet another tariff announcement.
- Investors are balking as the Trump administration widens its tariff scope.
The Dow Jones Industrial Average (DJIA) fell on Wednesday, backsliding back below the 42,500 level and snapping a recent winning run as investors recoil from more announcements to announce more tariffs from the Trump administration. United States (US) President Donald Trump has ramped up his latest round of tariff threats, with plans to target copper, automobiles and European goods, all while still threatening to impose wide-reaching “reciprocal” tariffs on April 2.
According to various avenues of information, the Trump administration still plans to move ahead with a wide tariff on all copper imports into the US, matching the Trump team’s recent 25% flat import tax on all steel and aluminum that cross the US border. President Trump also intends to announce additional tariffs on automobiles across the board, and European Union (EU) officials are expecting the Trump administration to announce a tariff of around 20% on all, or most, or a targeted group of goods, depending on what day it is and how Donald Trump is feeling at that time.
All of this may or may not be in addition to the anticipated “reciprocal” tariff package that President Trump intends to kick off on April 2, which countries may or may not be able to get exemptions from. Donald Trump intends to impose a matching tariff on other countries that have their own trade barriers on US goods, a rather perplexing approach to trade in general. President Trump has also floated the idea of classifying VAT, or luxury taxes, as a kind of pseudo-tariff on US goods, and including those in reciprocal tariffs.
US Durable Goods Orders eased far less than expected in February, increasing by a surprising 0.9% compared to the expected 1.0% contraction. The figure, while beating forecasts, still came in well below January’s revised 3.3%.
Policymakers have warned that the Trump administration’s long-winded trade war aspirations are beginning to hurt the US's economic prospects. Red flags are also being raised by key financial agencies: according to the Standard & Poor’s (S&P) Global ratings contingent, there is a 25% probability of a US recession kicking off within the next year. S&P Global specifically highlighted that “US policy uncertainty poses risks to North American credit conditions”.
Stocks news
Equities are down across the board on Wednesday, with investor sentiment getting pummeled by rising trade war fears. Tech stocks took the hardest hit, with the Nasdaq Composite tumbling 420 points, or 2.3%. The Dow Jones shed over 250 points, declining one-half of one percent and falling to 42,350, and the S&P 500 index fell 80 points, contracting by 1.4%.
Read more stock news: Procter & Gamble stock makes headway despite tariff worries
Dow Jones price forecast
The Dow Jones Industrial Average is set for a fresh downside challenge as the major equity index’s near-term bull run fizzles out. After a brief retest of the 42,800 level, bids are falling back and poised for a fresh decline to the 200-day Exponential Moving Average (EMA) near 42,090.
Technical oscillators show bulls still have some room to run, but it's a steep climb to recover record highs north of 45,000. On the low end, a backslide could mean an extended decline back below the latest swing low into 40,660.
Dow Jones daily chart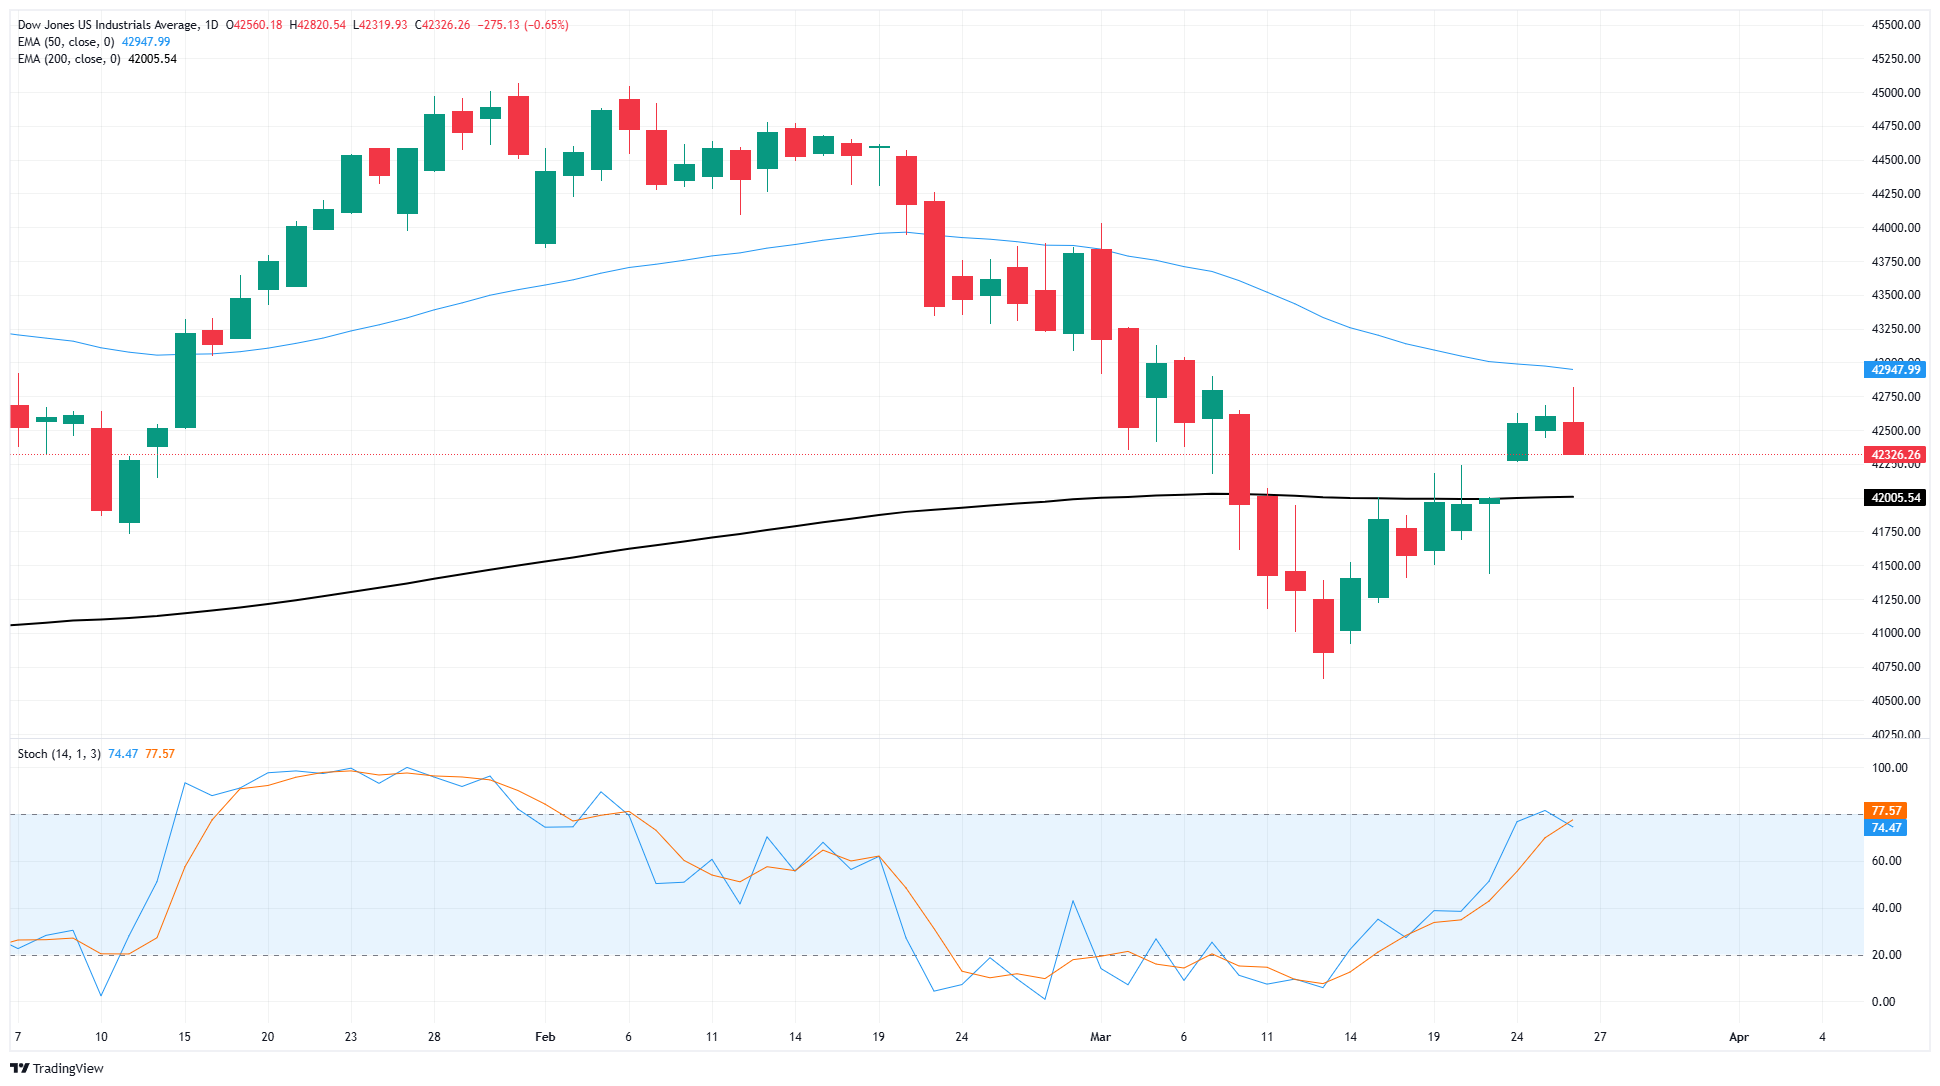
Dow Jones FAQs
The Dow Jones Industrial Average, one of the oldest stock market indices in the world, is compiled of the 30 most traded stocks in the US. The index is price-weighted rather than weighted by capitalization. It is calculated by summing the prices of the constituent stocks and dividing them by a factor, currently 0.152. The index was founded by Charles Dow, who also founded the Wall Street Journal. In later years it has been criticized for not being broadly representative enough because it only tracks 30 conglomerates, unlike broader indices such as the S&P 500.
Many different factors drive the Dow Jones Industrial Average (DJIA). The aggregate performance of the component companies revealed in quarterly company earnings reports is the main one. US and global macroeconomic data also contributes as it impacts on investor sentiment. The level of interest rates, set by the Federal Reserve (Fed), also influences the DJIA as it affects the cost of credit, on which many corporations are heavily reliant. Therefore, inflation can be a major driver as well as other metrics which impact the Fed decisions.
Dow Theory is a method for identifying the primary trend of the stock market developed by Charles Dow. A key step is to compare the direction of the Dow Jones Industrial Average (DJIA) and the Dow Jones Transportation Average (DJTA) and only follow trends where both are moving in the same direction. Volume is a confirmatory criteria. The theory uses elements of peak and trough analysis. Dow’s theory posits three trend phases: accumulation, when smart money starts buying or selling; public participation, when the wider public joins in; and distribution, when the smart money exits.
There are a number of ways to trade the DJIA. One is to use ETFs which allow investors to trade the DJIA as a single security, rather than having to buy shares in all 30 constituent companies. A leading example is the SPDR Dow Jones Industrial Average ETF (DIA). DJIA futures contracts enable traders to speculate on the future value of the index and Options provide the right, but not the obligation, to buy or sell the index at a predetermined price in the future. Mutual funds enable investors to buy a share of a diversified portfolio of DJIA stocks thus providing exposure to the overall index.
Recommended Articles


