

Dow Jones Industrial Average knocks lower on first day back after market holiday
- The Dow Jones backslid around 300 points early Tuesday following a long weekend.
- Equities recovered their footing, pushing back to flat amid a lack of meaningful data.
- Latest Fed Meeting Minutes are due on Wednesday as markets watch for signs of rate cuts.
The Dow Jones Industrial Average (DJIA) stumbled out of the gate on Tuesday, declining around 300 points at its lowest following an extended weekend break. Equities somewhat recovered their stance through the US market session, but the Dow Jones remains down around 100 points near 44,450. Stock traders piled back into markets following the President’s Day holiday on Monday, rushing to price in headlines before realizing there wasn’t much to price in.
Another Federal Reserve (Fed) policymaker noted on Tuesday that a murky policy outlook from the Trump administration makes it difficult to nail down a timeline for when the Fed might deliver another rate cut. The Fed’s latest Meeting Minutes are slated for release on Wednesday, but the report is unlikely to sharpen guidance any further. According to the CME’s FedWatch Tool, rate markets are pricing in better-than-even odds that the Fed’s next rate trim will be a 25 bps cut on July 30.
Looking ahead, the next key data print for US markets will be Friday’s upcoming global Purchasing Managers Index (PMI) prints. US PMI survey results are expected to tick slightly higher for both the Manufacturing and Services components.
Dow Jones news
Despite heavy losses in key contributing equities, the Dow Jones was overall tilted into the bullish side on Tuesday. Around two-thirds of the major equity index found room in the green, but sharp contractions in UnitedHealth (UNH) and Home Depot (HD) kept the DJIA on the bearish side.
UNH tumbled 17% on Tuesday, falling below $507 per share after the company resisted calls from shareholders to investigate the true costs of the health company’s logbook of denied and delayed healthcare claims. Shareholders submitted a proposal to do a more accurate cost accounting of UNH’s denial practices, citing “public health-related costs and macroeconomic risks created by the company’s practices that limit or delay access to healthcare”.
Home Depot also shed around 7%, falling below $403 per share after investors balked at underperforming US home sales and a general lack of confidence in price stability in the face of looming tariff action from the US government.
Dow Jones price forecast
Congestion continues to plague the Dow Jones Industrial Average as the major equity index battles near-term consolidation around the 44,500 region. Price action is getting squeezed into a chopping midrange, with a technical ceiling priced in around 44,800 and an immediate floor near the 50-day Exponential Moving Average (EMA) just south of the 44,000 major price handle.
Long-term, the DJIA is holding close enough to all-time highs to keep short interest nervous. The Dow Jones has trended above the 200-day EMA for 15 consecutive months, and is still holding onto gains of 4.7% from the start of the year.
Dow Jones daily chart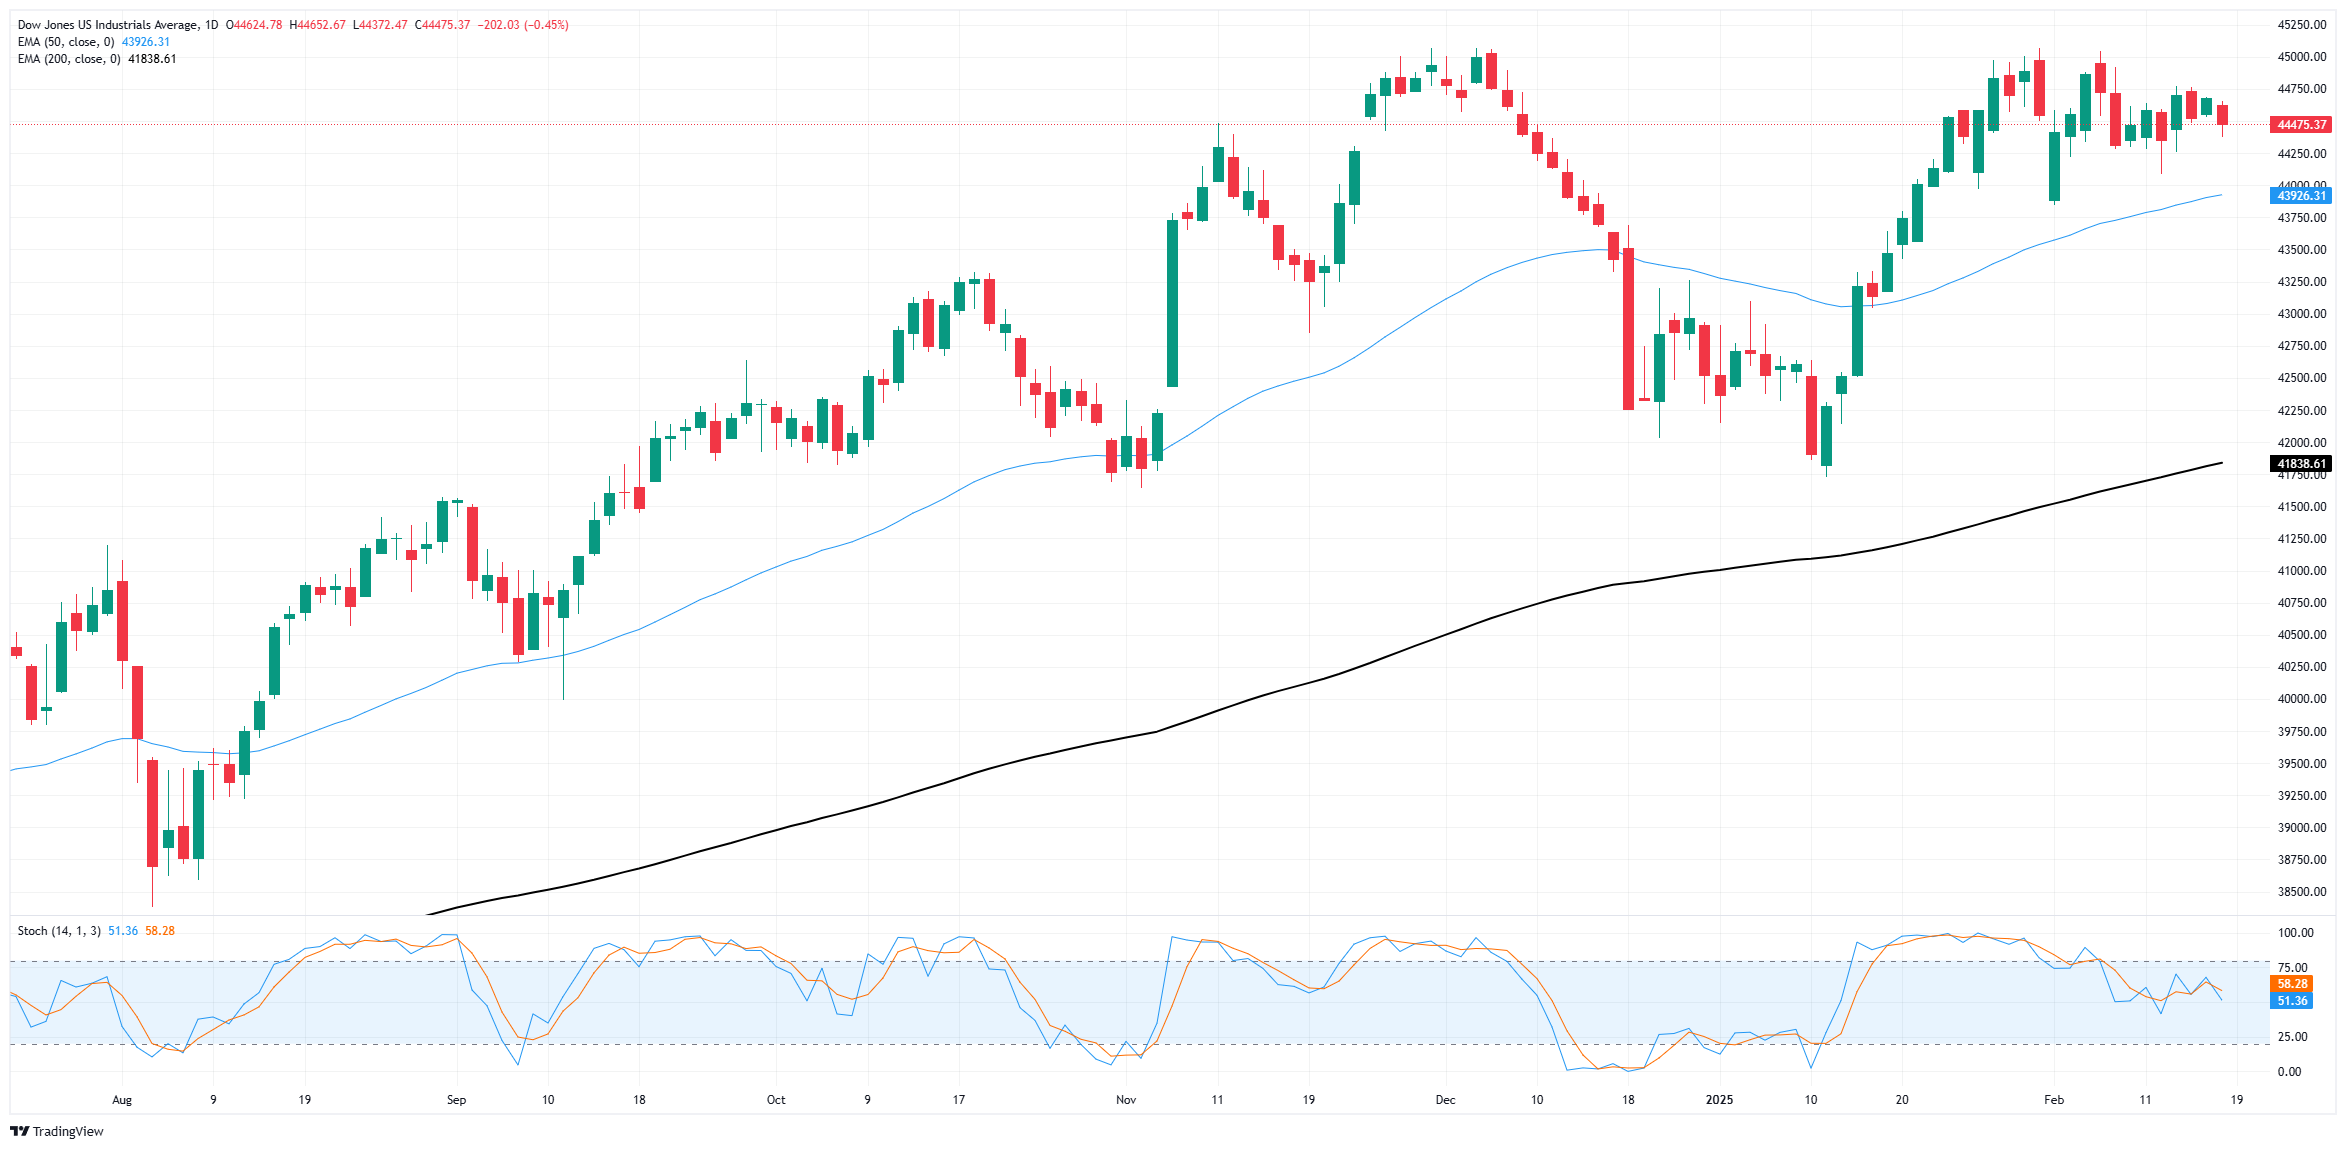
Dow Jones FAQs
The Dow Jones Industrial Average, one of the oldest stock market indices in the world, is compiled of the 30 most traded stocks in the US. The index is price-weighted rather than weighted by capitalization. It is calculated by summing the prices of the constituent stocks and dividing them by a factor, currently 0.152. The index was founded by Charles Dow, who also founded the Wall Street Journal. In later years it has been criticized for not being broadly representative enough because it only tracks 30 conglomerates, unlike broader indices such as the S&P 500.
Many different factors drive the Dow Jones Industrial Average (DJIA). The aggregate performance of the component companies revealed in quarterly company earnings reports is the main one. US and global macroeconomic data also contributes as it impacts on investor sentiment. The level of interest rates, set by the Federal Reserve (Fed), also influences the DJIA as it affects the cost of credit, on which many corporations are heavily reliant. Therefore, inflation can be a major driver as well as other metrics which impact the Fed decisions.
Dow Theory is a method for identifying the primary trend of the stock market developed by Charles Dow. A key step is to compare the direction of the Dow Jones Industrial Average (DJIA) and the Dow Jones Transportation Average (DJTA) and only follow trends where both are moving in the same direction. Volume is a confirmatory criteria. The theory uses elements of peak and trough analysis. Dow’s theory posits three trend phases: accumulation, when smart money starts buying or selling; public participation, when the wider public joins in; and distribution, when the smart money exits.
There are a number of ways to trade the DJIA. One is to use ETFs which allow investors to trade the DJIA as a single security, rather than having to buy shares in all 30 constituent companies. A leading example is the SPDR Dow Jones Industrial Average ETF (DIA). DJIA futures contracts enable traders to speculate on the future value of the index and Options provide the right, but not the obligation, to buy or sell the index at a predetermined price in the future. Mutual funds enable investors to buy a share of a diversified portfolio of DJIA stocks thus providing exposure to the overall index.
Recommended Articles


