

US Dollar retreats with possible peace talks between Russia and Ukraine fueling risk-on across markets
- The US Dollar trades weaker on Thursday against most major peers.
- Traders gear up for the Producer Price Index (PPI) and weekly jobless claims due later in the day.
- The US Dollar Index (DXY) drops below 108.00 and ekes out losses for this week.
The US Dollar Index (DXY), which tracks the performance of the US Dollar (USD) against six major currencies, has fallen to 107.50 so far on Thursday. The knee-jerk reaction comes after stronger-than-expected US Consumer Price Index (CPI) data for January was released on Wednesday, which pushed the US Dollar higher. However, the turnaround came in the US trading session when United States (US) President Donald Trump and Russian President Vladimir Putin agreed over the phone to start peace talks with Ukraine.
The economic calendar is focusing on US producer figures on Thursday. The January Producer Price Index (PPI) is due. The weekly US Jobless Claims will be released as well. Traders meanwhile can further digest the two-day testimony from US Federal Reserve (Fed) Chairman Jerome Powell at Capitol Hill.
Daily digest market movers: Some relief
- US President Trump issued a warning for Hamas and the Gaza region, demanding that Hamas releases all hostages by noon on Saturday or “all hell will break loose”, Reuters reports.
- The possibility of a start in peace talks between Russia and Ukraine is spurring risk assets and the Euro (EUR) against the US Dollar (USD). This, in turn, triggers a softer US Dollar Index. The Euro accounts for 57.6% of the weight in the DXY.
- At 13:30, nearly all important data for this Thursday will be released:
- US Jobless Claims for the week ending on February 7 are expected to slide to 215,000, coming from 219,000 in the previous week. Continuing Claims ending January 31 should decline as well to 1.880 million, coming from the previous 1.886 million.
- The monthly headline PPI for January is expected to tick up to 0.3%, from 0.2%.
- The monthly core PPI for January is expected to rise sharply to 0.3%, coming from 0% in December.
- Equities are in a good mood. European indices outpace US futures, and all major indices and futures are trading in the green.
- After the stronger-than-expected January CPI reading, the CME FedWatch tool shows a 64.3% chance that interest rates will remain unchanged at current levels in June, compared to 50.3% before the release. This suggests that the Fed would keep rates unchanged for longer to fight against persistent inflation.
- The US 10-year yield is trading around 4.607%, a touch softer from this week’s high of 4.657%.
US Dollar Index Technical Analysis: Wrong-footed
The US Dollar Index (DXY) is proving the thesis again that when all banks call for a specific direction or target level, the opposite will often materialize. At the start of this year, nearly all major banks predicted parity in EUR/USD as a given. With peace talks between Russia and Ukraine possibly underway and the tensions in Ukraine perhaps ending in 2025, a substantially weaker US Dollar might be a scenario only a few have kept as a possible outcome.
On the upside, the first barrier at 109.30 (July 14, 2022, high) was briefly surpassed but did not hold last week. Once that level is reclaimed, the next level to hit before advancing further remains at 110.79 (September 7, 2022, high).
On the downside, 107.35 (October 3, 2023, high) is still acting as strong support after several tests since late January. In case more downside occurs, look for 106.52 (April 16, 2024, high), 106.28 (100-day Simple Moving Average), or even 105.89 (resistance in June 2024) as better support levels.
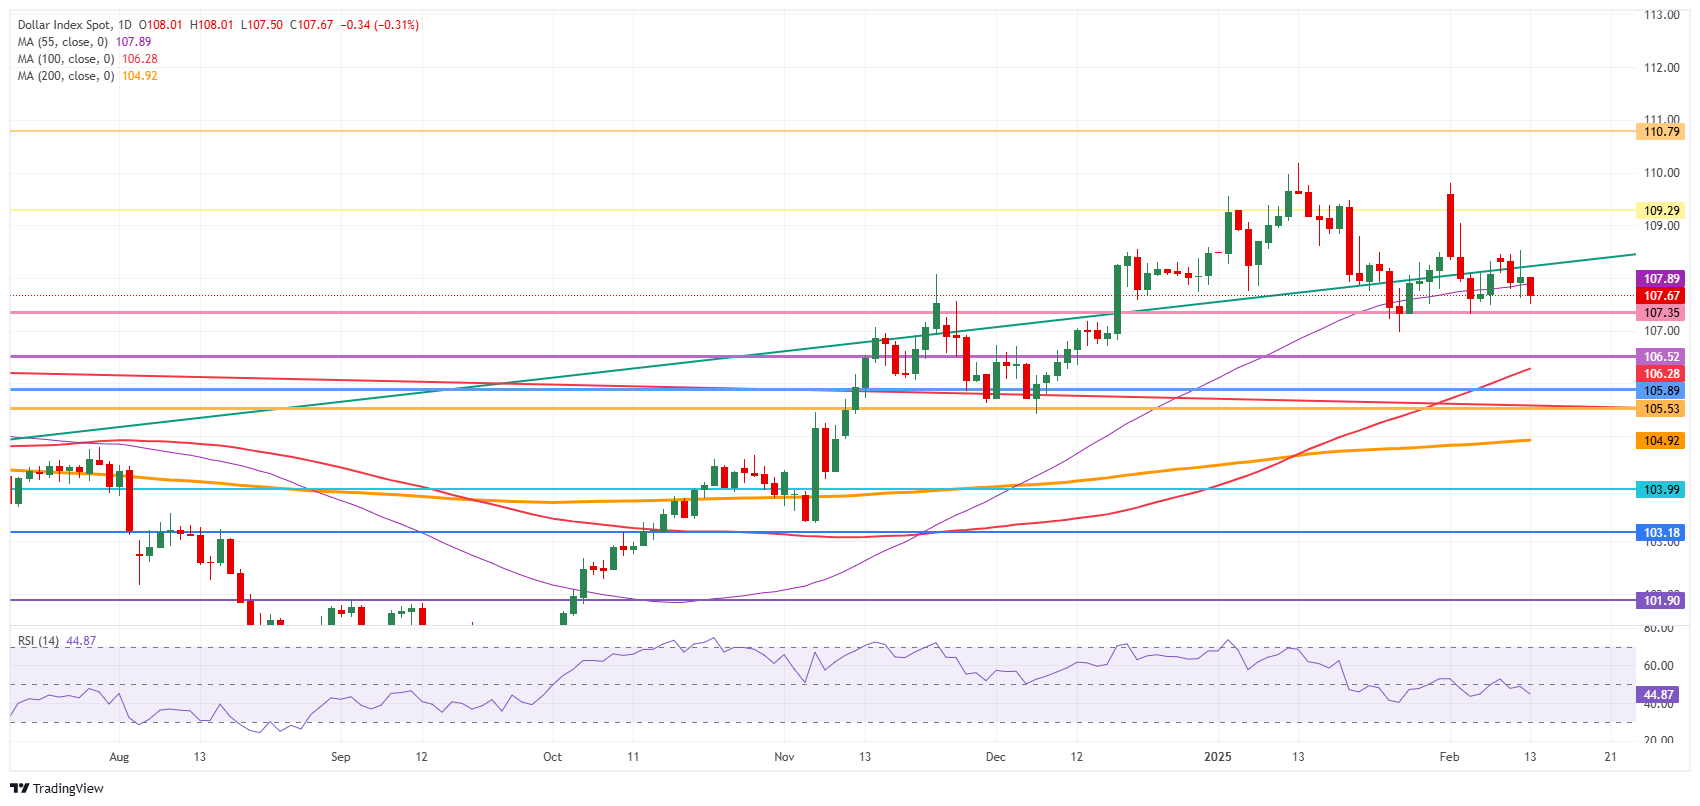
US Dollar Index: Daily Chart
US Dollar FAQs
The US Dollar (USD) is the official currency of the United States of America, and the ‘de facto’ currency of a significant number of other countries where it is found in circulation alongside local notes. It is the most heavily traded currency in the world, accounting for over 88% of all global foreign exchange turnover, or an average of $6.6 trillion in transactions per day, according to data from 2022. Following the second world war, the USD took over from the British Pound as the world’s reserve currency. For most of its history, the US Dollar was backed by Gold, until the Bretton Woods Agreement in 1971 when the Gold Standard went away.
The most important single factor impacting on the value of the US Dollar is monetary policy, which is shaped by the Federal Reserve (Fed). The Fed has two mandates: to achieve price stability (control inflation) and foster full employment. Its primary tool to achieve these two goals is by adjusting interest rates. When prices are rising too quickly and inflation is above the Fed’s 2% target, the Fed will raise rates, which helps the USD value. When inflation falls below 2% or the Unemployment Rate is too high, the Fed may lower interest rates, which weighs on the Greenback.
In extreme situations, the Federal Reserve can also print more Dollars and enact quantitative easing (QE). QE is the process by which the Fed substantially increases the flow of credit in a stuck financial system. It is a non-standard policy measure used when credit has dried up because banks will not lend to each other (out of the fear of counterparty default). It is a last resort when simply lowering interest rates is unlikely to achieve the necessary result. It was the Fed’s weapon of choice to combat the credit crunch that occurred during the Great Financial Crisis in 2008. It involves the Fed printing more Dollars and using them to buy US government bonds predominantly from financial institutions. QE usually leads to a weaker US Dollar.
Quantitative tightening (QT) is the reverse process whereby the Federal Reserve stops buying bonds from financial institutions and does not reinvest the principal from the bonds it holds maturing in new purchases. It is usually positive for the US Dollar.
Recommended Articles


