


Dow Jones Industrial Average declines further on Friday
- The Dow Jones shed another third of a percent to wrap up the trading week.
- US NFP jobs figures came in above expectations, but the US Unemployment Rate also rose.
- Steep losses in key stocks are dragging the Dow Jones lower.
The Dow Jones Industrial Average (DJIA) turned lower on Friday, shedding another 140 points and dragging the equity index into the low end while its major counterparts step higher on better-than-expected Nonfarm Payrolls (NFP) job additions.
The US NFP net jobs count rebounded firmly in November, rising by 227K versus the forecast 220K, recovering from October’s revised 36K. However, the US Unemployment Rate also rose to 4.2% as expected in November, ticking up from the previous month’s 4.1%. The upswing in reported jobless consumers crimped the market’s overall upbeat mood, keeping bullish momentum capped across global equity markets.
Markets have upped their bets of of a 25 bps rate cut from the Federal Reserve (Fed) on December 18. Rate traders piled into odds of at least a quarter-point trim in two weeks, raising them to 85%, with the remaining 15% of betters still banking on a hold call from the Fed.
Dow Jones news
Despite a dip in the headline index, the Dow Jones was roughly balanced on Friday, with half of the board’s listed stocks rising through the day’s trading. However, key losses on the bottom end are dragging down the average headline rating, with the day’s top-performing DJIA-listed stock unable to counteract the backslide.Amazon (AMZN) rose 3% on Friday, pushing above $227 per share as the giant company’s share price continues to rise to record highs.
Unitedhealth Group (UNH) dragged the Dow Jones lower on Friday, tumbling another 5% and falling beneath $550 per share after the CEO of the health giant’s insurance arm, UnitedHealthcare, was gunned down in broad daylight this week in New York. The head of UnitedHealthcare was exiting his hotel early in the morning, heading to a shareholder’s meeting. The chief steward of one of the US’ most prolific claims rejector, with roughly 30% of all health coverage requests being rejected, has become post-humously famous for being the head of the insurance company that intentionally handed over control of client health claims to an AI with a 90% inaccuracy rating.
Dow Jones price forecast
Despite softening further on Friday and dragging the major equity index into a down week, the Dow Jones is trading firmly into bull country and still holding north of 44,500. The DJIA slipped back below the 45,000 major handle this week, but bearish pressure remains tepid at best.
The Dow Jones is still up over 18% YTD, having gained nearly 7.6% in November alone. An extended pullback to the 50-day Exponential Moving Average (EMA) rising through 43,350 will likely see a fresh round of tailwinds as investors remain staunch bidders.
Dow Jones daily chart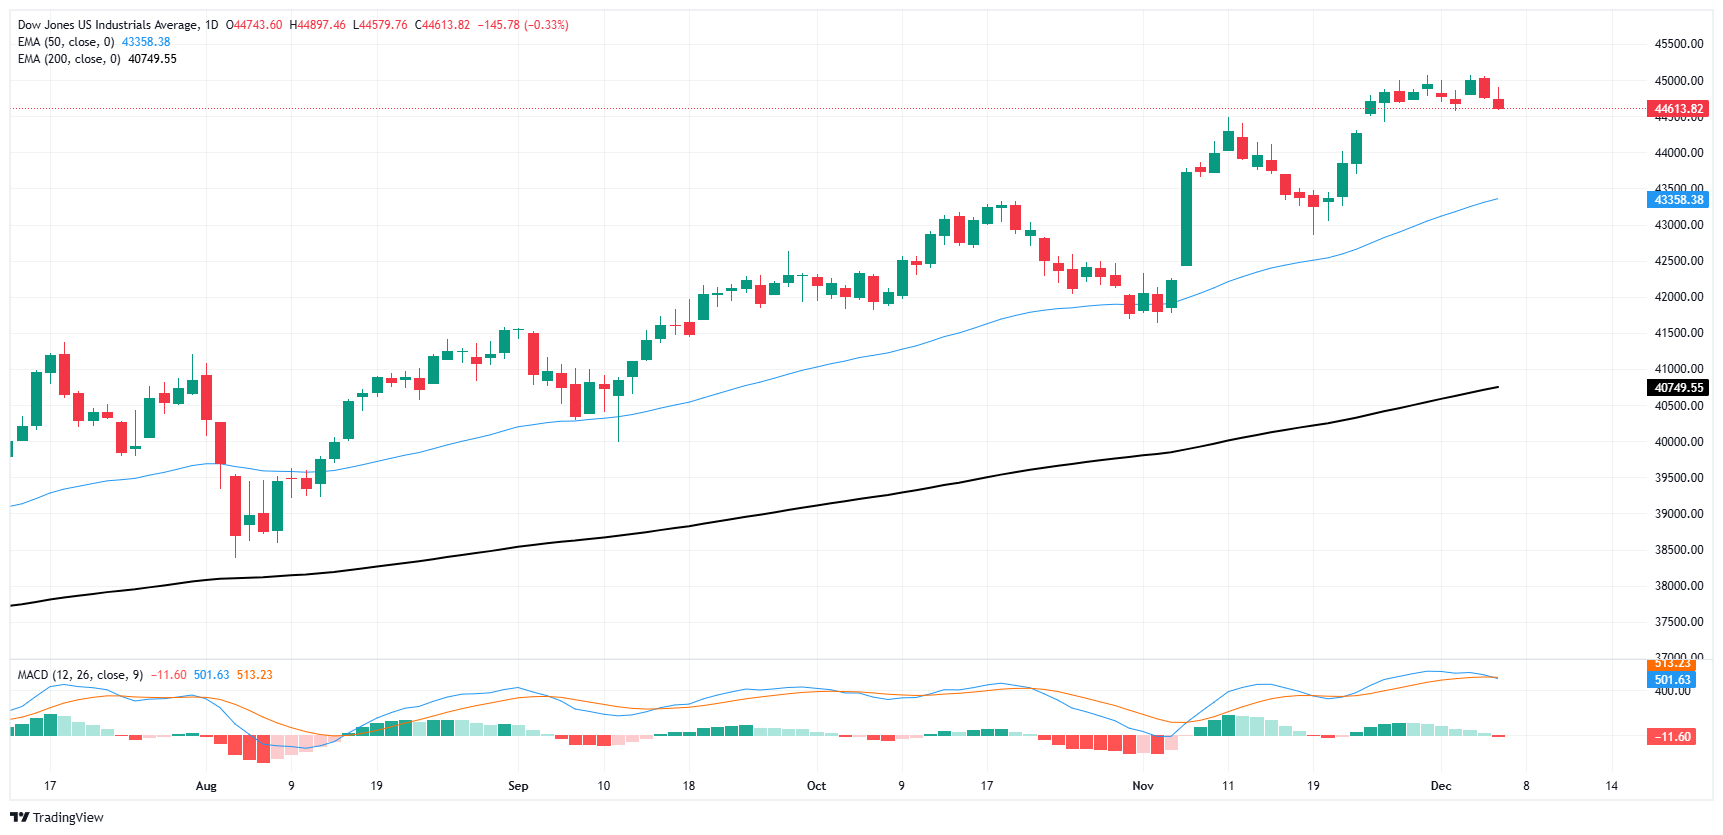
Dow Jones FAQs
The Dow Jones Industrial Average, one of the oldest stock market indices in the world, is compiled of the 30 most traded stocks in the US. The index is price-weighted rather than weighted by capitalization. It is calculated by summing the prices of the constituent stocks and dividing them by a factor, currently 0.152. The index was founded by Charles Dow, who also founded the Wall Street Journal. In later years it has been criticized for not being broadly representative enough because it only tracks 30 conglomerates, unlike broader indices such as the S&P 500.
Many different factors drive the Dow Jones Industrial Average (DJIA). The aggregate performance of the component companies revealed in quarterly company earnings reports is the main one. US and global macroeconomic data also contributes as it impacts on investor sentiment. The level of interest rates, set by the Federal Reserve (Fed), also influences the DJIA as it affects the cost of credit, on which many corporations are heavily reliant. Therefore, inflation can be a major driver as well as other metrics which impact the Fed decisions.
Dow Theory is a method for identifying the primary trend of the stock market developed by Charles Dow. A key step is to compare the direction of the Dow Jones Industrial Average (DJIA) and the Dow Jones Transportation Average (DJTA) and only follow trends where both are moving in the same direction. Volume is a confirmatory criteria. The theory uses elements of peak and trough analysis. Dow’s theory posits three trend phases: accumulation, when smart money starts buying or selling; public participation, when the wider public joins in; and distribution, when the smart money exits.
There are a number of ways to trade the DJIA. One is to use ETFs which allow investors to trade the DJIA as a single security, rather than having to buy shares in all 30 constituent companies. A leading example is the SPDR Dow Jones Industrial Average ETF (DIA). DJIA futures contracts enable traders to speculate on the future value of the index and Options provide the right, but not the obligation, to buy or sell the index at a predetermined price in the future. Mutual funds enable investors to buy a share of a diversified portfolio of DJIA stocks thus providing exposure to the overall index.
Recommended Articles


