

US Dollar rallies on Trump tariff threats against BRICS, French political turmoil
- The US Dollar rises after Donald Trump threatens BRICS with tariffs and increasing political concerns in France about the stability of the government.
- A political fallout in the Eurozone could trigger more inflows from the Euro to the Greenback.
- The US Dollar Index spikes back above 106.00, though it faces a key level ahead at 106.52.
The US Dollar (USD) gains on Monday, paring back Friday’s losses, driven by Donald Trump’s promise to impose tariffs on BRICS countries if they stop using the USD and amid increasing French political turmoil, which is weighing on the Euro (EUR).
In a post on Saturday, the US President-elect said he would impose a 100% tariff on the BRICS if the group decides to move away from trading using the USD. “We require a commitment from these Countries that they will neither create a new BRICS Currency, nor back any other Currency to replace the mighty U.S. Dollar or, they will face 100% Tariffs, and should expect to say goodbye to selling into the wonderful U.S. Economy,” he said.
Investors are also punishing the EUR – the main currency within the DXY US Dollar Index basket – on the back of failed budget talks in France and increasing chances that a no-confidence vote against the current prime minister is approved. Finance Minister Antoine Armand said on Bloomberg television over the weekend that France will not be blackmailed on far-right demands from the National Rally (NR) of Marine Le Pen, which is asking for changes in the budget bill. The NR President Jordan Bardella said on Monday that its party will trigger a no-confidence vote mechanism “unless there is a last-minute miracle,” Reuters reports.
A no-confidence vote could take place as early as Wednesday, and if successful it could bring the French government down.
Meanwhile, the US economic calendar is set to kick off with an eventful Monday ahead, with the Institute for Supply Management (ISM) releasing its Manufacturing PMI numbers for November.
Daily digest market movers: ISM kicks off packed week
- In a televised interview over the weekend, French Finance Minister Antoine Armand said on Bloomberg television that the French government will not be held hostage by the far-right party of Marine Le Pen. By pushing back on the additional demands from the National Rally party, the French government could fall as a no-confidence vote will get enough votes if Marine Le Pen’s party backs the vote with its majority.
- At 14:45 GMT, S&P Global will release the final reading for November of its Manufacturing Purchase Managers Index (PMI) survey. The expectation is for a steady 48.8, unchanged from the preliminary reading.
- Near 15:00 GMT, the Institute for Supply Management (ISM) will release its November PMI data for the Manufacturing Sector. The headline PMI is set to tick up to 47.5, from 46.5, but still stuck in contraction territory. The Prices Paid index, a leading indicator of inflation, is expected to tick up to 55.2 from 54.8.
- Near 20:15 GMT, Federal Reserve Governor Christopher Waller delivers a speech about the US economic outlook at the American Institute for Economic Research Monetary Conference in Washington DC.
- At 21:30 GMT, Federal Reserve Bank of New York President John Williams delivers keynote remarks and participates in a Q&A session at an event organized by the Queens Chamber of Commerce in New York.
- Equities in Europe and the US Futures are not really happy with the turn of events in France. Losses are contained though, by less than 0.50% on average.
- The CME FedWatch Tool is pricing in another 25 basis points (bps) rate cut by the Fed at the December 18 meeting by 67.1%. A 32.9% chance is for rates to remain unchanged. The Fed Minutes helped the rate cut odds for December to move higher.
- The US 10-year benchmark rate trades at 4.21%, rather steady for the start of the week and above the 4.16% seen last week on Friday.
US Dollar Index Technical Analysis: France could spread out
The US Dollar Index (DXY) is seeing a flight from across the Atlantic Ocean, with investors pulling out some investments out of Europe and into the US. A potential fall of the French government could quickly spill over into Germany, where Prime Minister Olaf Scholz position is hanging by a threadahead of the 2025 elections. All this political uncertainty could block investment opportunities, with investors favoring the equity-supportive Trump administration that is set to take over in January.
On the upside, 106.52 (April 16 high) is the first level to watch and looks ready to be tested already this Monday. Should the Dollar bulls reclaim that level, 107.00 (round level) and 107.35 (October 3, 2023, high) are back on target for a retest.
However, warnings for a knee-jerk reaction need to be issued. In case of a downturn, the pivotal level at 105.53 (April 11 high) comes into play before heading into the 104-region. Should the DXY fall all the way towards 104.00, the big figure and the 200-day Simple Moving Average at 104.03 should catch any falling knife formation.
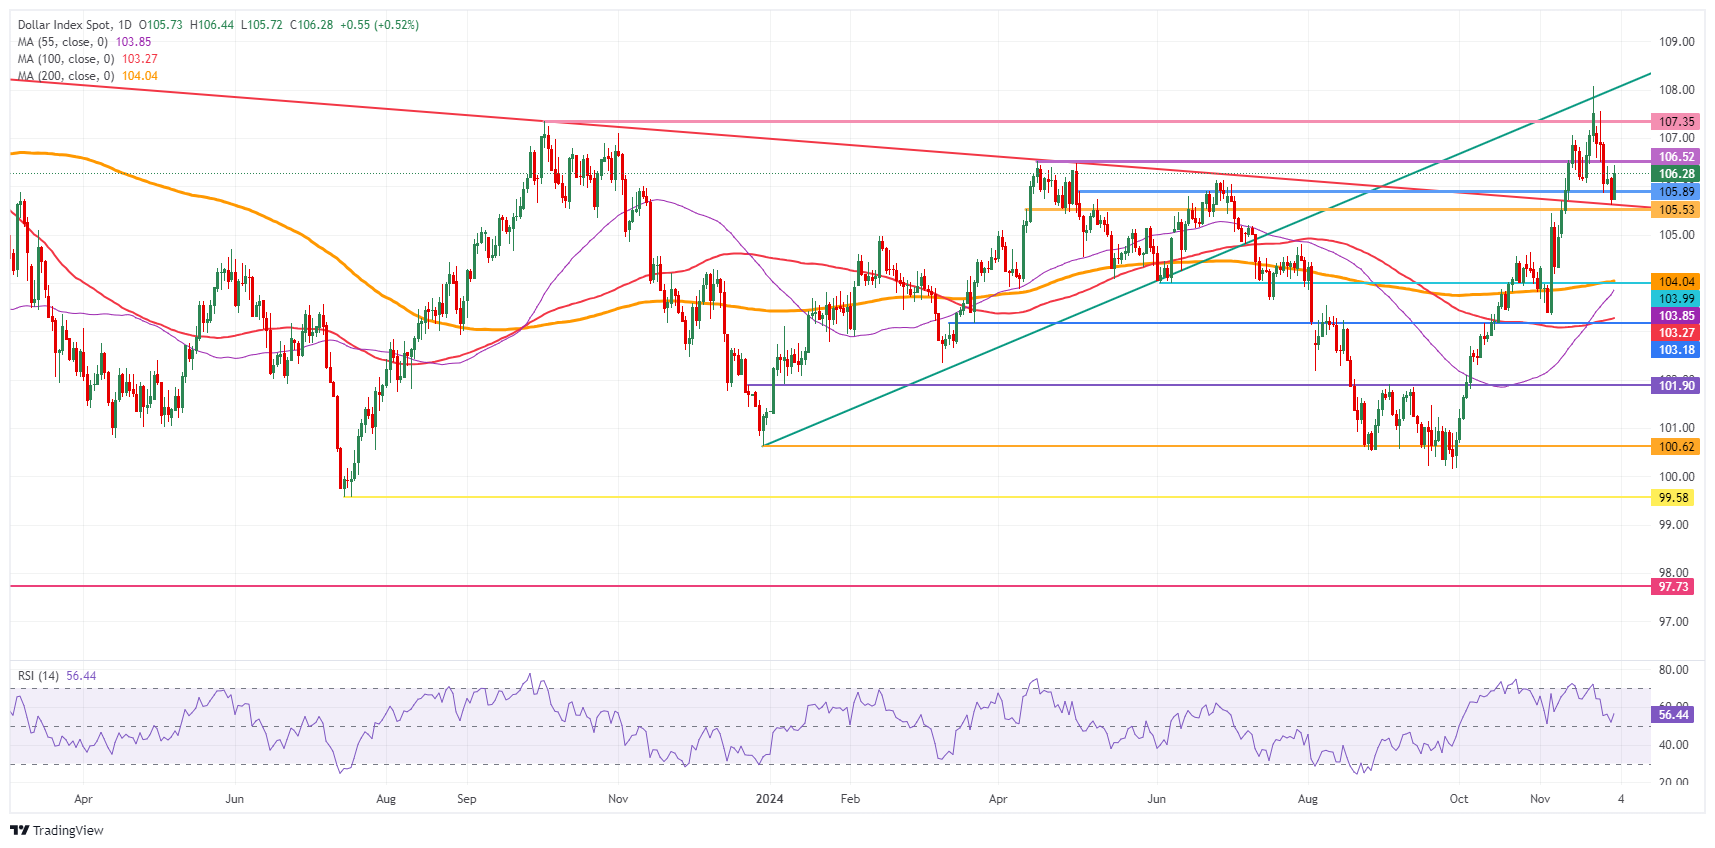
US Dollar Index: Daily Chart
US Dollar FAQs
The US Dollar (USD) is the official currency of the United States of America, and the ‘de facto’ currency of a significant number of other countries where it is found in circulation alongside local notes. It is the most heavily traded currency in the world, accounting for over 88% of all global foreign exchange turnover, or an average of $6.6 trillion in transactions per day, according to data from 2022. Following the second world war, the USD took over from the British Pound as the world’s reserve currency. For most of its history, the US Dollar was backed by Gold, until the Bretton Woods Agreement in 1971 when the Gold Standard went away.
The most important single factor impacting on the value of the US Dollar is monetary policy, which is shaped by the Federal Reserve (Fed). The Fed has two mandates: to achieve price stability (control inflation) and foster full employment. Its primary tool to achieve these two goals is by adjusting interest rates. When prices are rising too quickly and inflation is above the Fed’s 2% target, the Fed will raise rates, which helps the USD value. When inflation falls below 2% or the Unemployment Rate is too high, the Fed may lower interest rates, which weighs on the Greenback.
In extreme situations, the Federal Reserve can also print more Dollars and enact quantitative easing (QE). QE is the process by which the Fed substantially increases the flow of credit in a stuck financial system. It is a non-standard policy measure used when credit has dried up because banks will not lend to each other (out of the fear of counterparty default). It is a last resort when simply lowering interest rates is unlikely to achieve the necessary result. It was the Fed’s weapon of choice to combat the credit crunch that occurred during the Great Financial Crisis in 2008. It involves the Fed printing more Dollars and using them to buy US government bonds predominantly from financial institutions. QE usually leads to a weaker US Dollar.
Quantitative tightening (QT) is the reverse process whereby the Federal Reserve stops buying bonds from financial institutions and does not reinvest the principal from the bonds it holds maturing in new purchases. It is usually positive for the US Dollar.
Recommended Articles


