

Dow Jones Industrial Average climbs 600 points on Thursday surge
- The Dow Jones climbed more than one percent on Thursday.
- Investors have renewed their vigor after a brief pullback period.
- Markets shrug off decline in manufacturing surveys, bid up softer benefits claims.
The Dow Jones Industrial Average (DJIA) lurched higher on Thursday, climbing upwards of 550 points as investors stepped back into their bidding shoes. Weekly US Jobless Claims eased slightly on a weekly basis, while traders brushed off a contraction in the Philadelphia Fed Manufacturing Index. Markets also bid up an upswing in Existing Home Sales Change. Industrials and Financials are the strongest-performing sectors for the day.
US Initial Jobless Claims printed lower than expected on Thursday, showing 213K net new jobless benefits seekers for the week ended November 15, below the 220K expected and down from the previous revised weekly figure of 219K. Existing Home Sales Change also accelerated in October, rising to 3.4% after the previous month’s revised -1.3% contraction.
The Philadelphia Fed’s Manufacturing Survey for November threw up another warning sign, pulling back to -5.5 and falling sharply from the previous month’s 10.3 and tumbling past the median forecast of 8.0. The downside print in aggregated expectations did little to contain markets, which were determined to shake off near-term declines and push back toward record highs.
Dow Jones news
A broad uptick in sector-wide risk appetite on Thursday has bolstered the Dow Jones back into the bullish end, with all but five of the major index’s listed securities climbing from the day’s opening bids. Salesforce (CRM) rose nearly 5%, breaking above $341 per share as analysts raise their price forecasts for CRM ahead of the digital database management company’s third-quarter earnings reports due during the first week of December.
Dow Jones price forecast
The Dow Jones is back into testing the 44,000 major handle on Thursday, rallying 600 points from the day’s lows near 43,200. After a brief backslide that saw the major equity index decline 3.7% from record highs near 44,485, bullish momentum has returned to the fold.
A consistent pattern of higher lows has kept the gas burning in a one-sided bull run that kicked off in November of 2023. Price action has entirely outrun the 200-day Exponential Moving Average (EMA) for 12 months straight, and timing short entries is proving to be a hazardous endeavor. Bidders still have to push prices above 44,400 before they can claim further record highs, and the 50-day EMA is keeping a tight technical floor under intraday momentum from 42,600.
Dow Jones daily chart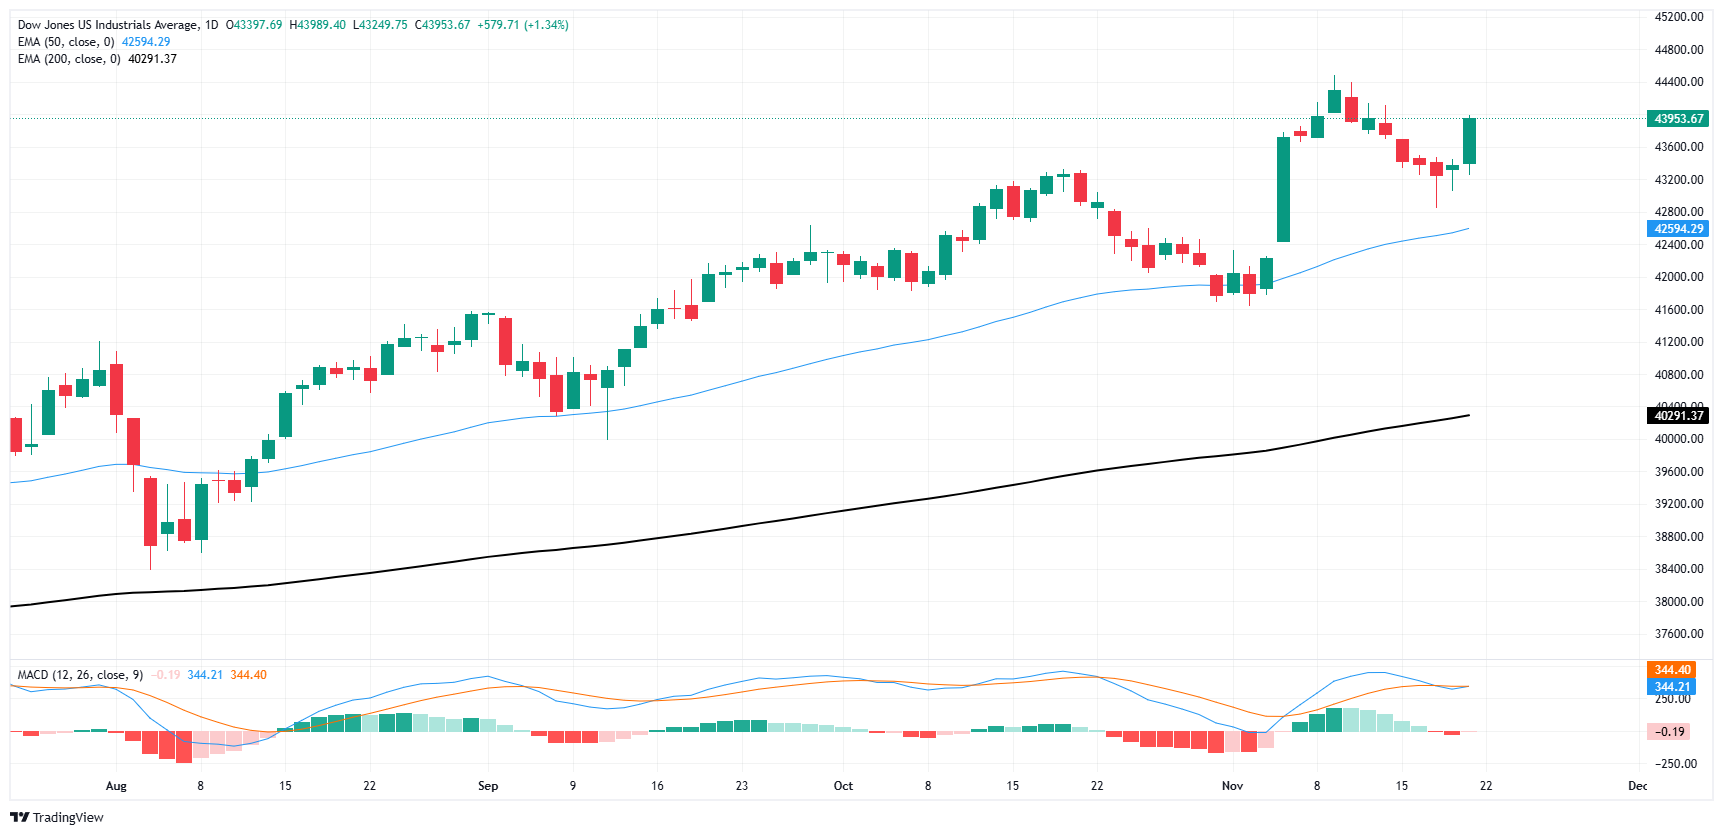
Dow Jones FAQs
The Dow Jones Industrial Average, one of the oldest stock market indices in the world, is compiled of the 30 most traded stocks in the US. The index is price-weighted rather than weighted by capitalization. It is calculated by summing the prices of the constituent stocks and dividing them by a factor, currently 0.152. The index was founded by Charles Dow, who also founded the Wall Street Journal. In later years it has been criticized for not being broadly representative enough because it only tracks 30 conglomerates, unlike broader indices such as the S&P 500.
Many different factors drive the Dow Jones Industrial Average (DJIA). The aggregate performance of the component companies revealed in quarterly company earnings reports is the main one. US and global macroeconomic data also contributes as it impacts on investor sentiment. The level of interest rates, set by the Federal Reserve (Fed), also influences the DJIA as it affects the cost of credit, on which many corporations are heavily reliant. Therefore, inflation can be a major driver as well as other metrics which impact the Fed decisions.
Dow Theory is a method for identifying the primary trend of the stock market developed by Charles Dow. A key step is to compare the direction of the Dow Jones Industrial Average (DJIA) and the Dow Jones Transportation Average (DJTA) and only follow trends where both are moving in the same direction. Volume is a confirmatory criteria. The theory uses elements of peak and trough analysis. Dow’s theory posits three trend phases: accumulation, when smart money starts buying or selling; public participation, when the wider public joins in; and distribution, when the smart money exits.
There are a number of ways to trade the DJIA. One is to use ETFs which allow investors to trade the DJIA as a single security, rather than having to buy shares in all 30 constituent companies. A leading example is the SPDR Dow Jones Industrial Average ETF (DIA). DJIA futures contracts enable traders to speculate on the future value of the index and Options provide the right, but not the obligation, to buy or sell the index at a predetermined price in the future. Mutual funds enable investors to buy a share of a diversified portfolio of DJIA stocks thus providing exposure to the overall index.
Recommended Articles


