


Dow Jones Industrial Average climbs to another record high on Monday
- The Dow Jones found a fresh all-time peak at the start of the week.
- Investors have leaned firmer into risk appetite ahead of a hefty earnings week.
- The Dow Jones has gained over 12% from August’s swing low.
The Dow Jones Industrial Average (DJIA) climbed to another record high on Columbus Day Monday, testing above the 43,000 handle and poised to enter a sixth consecutive week in the green. Wall Street is geared up for a hectic earnings reporting week, and this week’s US data docket is a smattering of mid-tier Federal Reserve (Fed) policymaker appearances with key US Retail Sales figures slated for Thursday.
JPMorgan Chase (JPM) and Wells Fargo (WFC) kicked off earnings season late last week on the high side, and markets are hoping for more of the same from the rest of the banking sector. Bank of America (BAC) and Goldman Sachs (GS) will be reporting Q3 earnings on Tuesday, joined by pharma giant Johnson & Johnson (JNJ). Morgan Stanley (MS) will round out finance sector earnings on Wednesday alongside United Airlines (UAL), with Walgreens Boots Alliance (WBA), Netflix (NFLX), and Proctor & Gamble (PG) due later in the week.
Dow Jones news
Despite a firm leg higher into bull country, the Dow Jones was relatively balanced during Monday’s US market session, with roughly half of the equity index’s constituent securities testing into the red. Losses were lead by Caterpillar (CAT) which fell nearly 2% and slipped below $395 per share as construction stocks waffle following a notable lack of gunpowder behind recently-announced Chinese stimulus measures meant to bolster China’s lagging housing and construction markets.
On the high side, Travelers Companies (TRV), Unitedhealth Group (UNH), and Mcdonald’s (MCD) are competing for the top spot, with all three companies rising around 1.5%. Travelers Companies rose to $240 per share, with Unitedhealth crossing above $606 per share and McDonald’s climbing toward $310 per share.
Dow Jones price forecast
The Dow Jones continues to push through key resistance levels and extend bullish momentum into record levels. With the Dow breaking through September’s technical barriers and crossing over 43,000, the next target for bulls will be the 44,000 psychological level.
The Dow Jones has gained nearly 8% from September’s swing low into the 50-day Exponential Moving Average (EMA), rallying firmly from a test of the 40,000 handle. The major equity index continues to grind out chart paper north of the 200-day EMA rising into 39,400, and bidders have refused to let price action touch the long-run moving average since November of 2023, when the Dow Jones was grappling with 34,000.
Dow Jones daily chart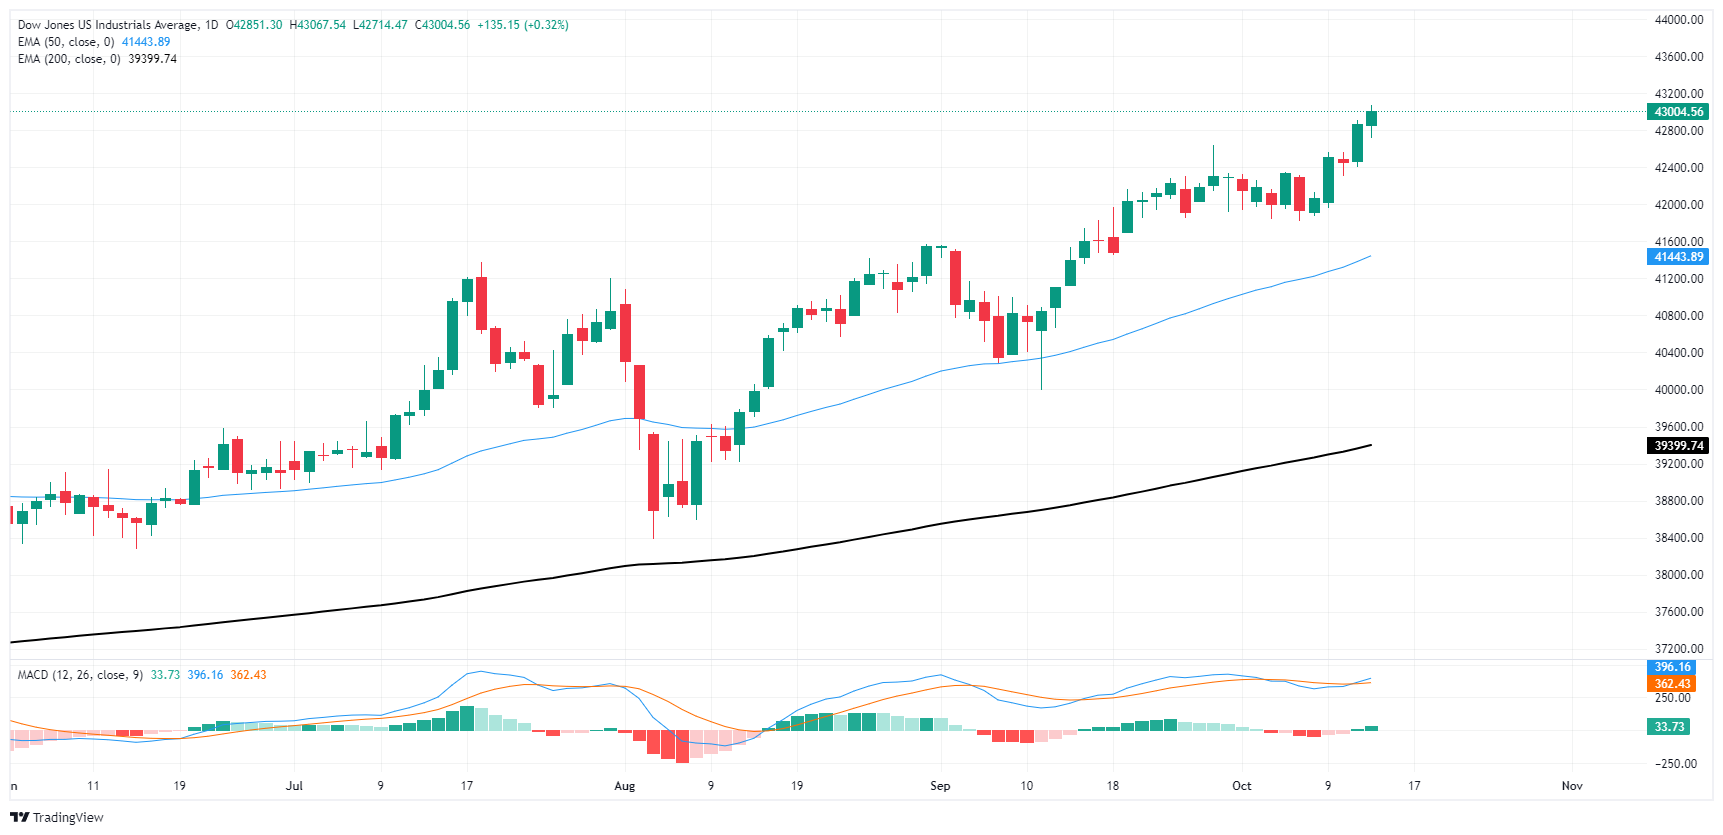
Dow Jones FAQs
The Dow Jones Industrial Average, one of the oldest stock market indices in the world, is compiled of the 30 most traded stocks in the US. The index is price-weighted rather than weighted by capitalization. It is calculated by summing the prices of the constituent stocks and dividing them by a factor, currently 0.152. The index was founded by Charles Dow, who also founded the Wall Street Journal. In later years it has been criticized for not being broadly representative enough because it only tracks 30 conglomerates, unlike broader indices such as the S&P 500.
Many different factors drive the Dow Jones Industrial Average (DJIA). The aggregate performance of the component companies revealed in quarterly company earnings reports is the main one. US and global macroeconomic data also contributes as it impacts on investor sentiment. The level of interest rates, set by the Federal Reserve (Fed), also influences the DJIA as it affects the cost of credit, on which many corporations are heavily reliant. Therefore, inflation can be a major driver as well as other metrics which impact the Fed decisions.
Dow Theory is a method for identifying the primary trend of the stock market developed by Charles Dow. A key step is to compare the direction of the Dow Jones Industrial Average (DJIA) and the Dow Jones Transportation Average (DJTA) and only follow trends where both are moving in the same direction. Volume is a confirmatory criteria. The theory uses elements of peak and trough analysis. Dow’s theory posits three trend phases: accumulation, when smart money starts buying or selling; public participation, when the wider public joins in; and distribution, when the smart money exits.
There are a number of ways to trade the DJIA. One is to use ETFs which allow investors to trade the DJIA as a single security, rather than having to buy shares in all 30 constituent companies. A leading example is the SPDR Dow Jones Industrial Average ETF (DIA). DJIA futures contracts enable traders to speculate on the future value of the index and Options provide the right, but not the obligation, to buy or sell the index at a predetermined price in the future. Mutual funds enable investors to buy a share of a diversified portfolio of DJIA stocks thus providing exposure to the overall index.
Recommended Articles


