Dow Jones Industrial Average hits fresh record high after slack PPI print

Source Fxstreet
  • The Dow Jones climbed into an all-time peak on Friday.
  • US PPI figures showed September producer-level inflation stayed flat overall.
  • Upbeat bank earnings helped to further bolster equities.

The Dow Jones Industrial Average (DJIA) rose over 400 points bottom-to-top on Friday, bolstered into a fresh record high of 42,837 after US Producer Price Index (PPI) inflation figures cooled in September. Cooling producer-level inflation plus upbeat bank earnings lifted equities across the board as the Dow Jones heads into a fifth straight winning week.

US producer prices flattened in September, cooling to a flat 0.0% MoM compared to the expected 0.1% and August’s 0.2%. Despite the cool-off in the monthly figure, September’s YoY PPI print chilled less than expected, printing at 1.8% versus the expected 1.6%, but still came in under August’s revised print of 1.9%.

Despite the rate-cut-supporting chill in headline PPI figures, core PPI inflation still poses a threat. Core PPI inflation, excluding food and energy prices, actually rose to 2.8% YoY in September, over and above the anticipated 2.7%. August’s annualized PPI figure was also revised to 2.6% from the initial print of 2.4%.

The University of Michigan’s (UoM) Consumer Sentiment Index eased in October, declining to 68.9 from the previous print of 70.1. Markets were hoping for a slight uptick to 70.8. Meanwhile, UoM 5-year Consumer Inflation Expectations delivered good news to markets, ticking down to 3.0% from the previous print of 3.1%.

Dow Jones news

The Dow Jones was tilted firmly into the bullish side on Friday, with less than ten of the equity board’s constituent securities stuck in the red during the last trading session of the week. IBM (IBM) fell another percentage point, declining below $231 per share, followed closely by Salesforce (CRM), which shed around eight-tenths of one percent, slipping under $288 per share.

In other Dow Jones news, bank earnings season is helping to bolster the major index into a record Friday, with JPMorgan surging after a better-than-expected earnings report that handily beat forecasts.

Dow Jones price forecast

The Dow Jones added around 300 points today, gaining roughly two-thirds of a percent and trading near 42,700. This latest move comes after the index made several attempts to break above the key resistance near 42,700 over the past few sessions. The strength of today’s rally suggests that the bulls are gaining momentum, helped by a broader optimism in equities. Traders will be watching to see if the index can maintain its momentum and build on today’s gains, potentially aiming for the 43,000 mark, a psychological resistance level.

Technical indicators show continued support for a bullish outlook. The 50-day Exponential Moving Average (EMA) remains well below current price action, suggesting that short-term momentum favors the bulls. The 200-day EMA is still grinding higher, approaching 39,400, reinforcing the long-term uptrend that has been in place since early 2023. With prices trending well above these key averages, buyers appear to be in firm control of the market, though a short-term pullback to the 50-day EMA is always possible as the market digests recent gains.

Dow Jones daily chart
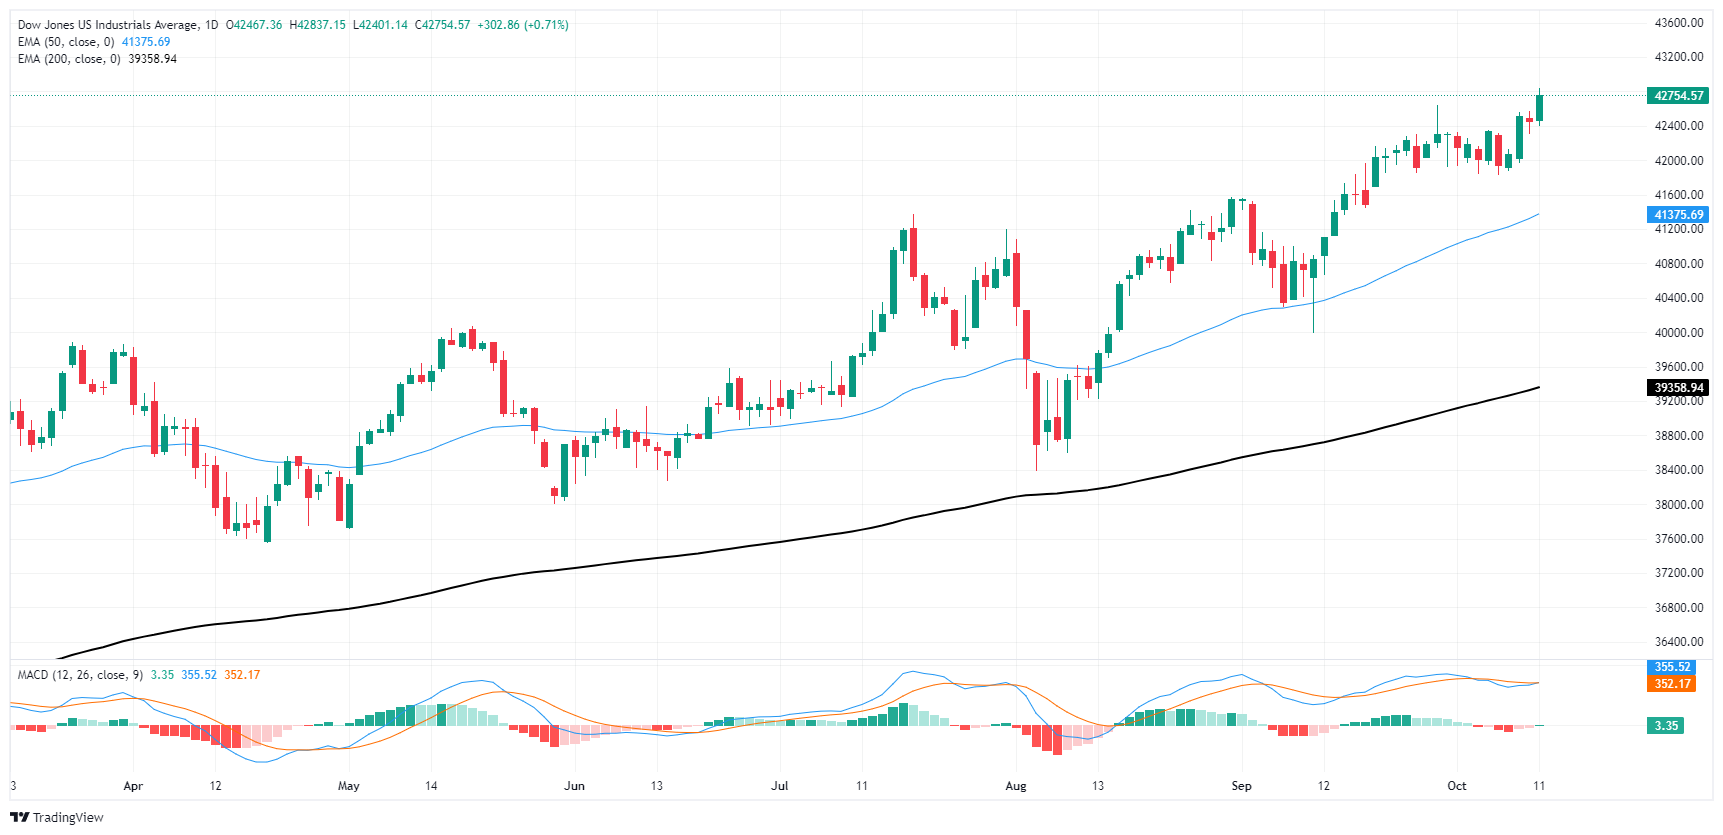
Dow Jones FAQs

The Dow Jones Industrial Average, one of the oldest stock market indices in the world, is compiled of the 30 most traded stocks in the US. The index is price-weighted rather than weighted by capitalization. It is calculated by summing the prices of the constituent stocks and dividing them by a factor, currently 0.152. The index was founded by Charles Dow, who also founded the Wall Street Journal. In later years it has been criticized for not being broadly representative enough because it only tracks 30 conglomerates, unlike broader indices such as the S&P 500.

Many different factors drive the Dow Jones Industrial Average (DJIA). The aggregate performance of the component companies revealed in quarterly company earnings reports is the main one. US and global macroeconomic data also contributes as it impacts on investor sentiment. The level of interest rates, set by the Federal Reserve (Fed), also influences the DJIA as it affects the cost of credit, on which many corporations are heavily reliant. Therefore, inflation can be a major driver as well as other metrics which impact the Fed decisions.

Dow Theory is a method for identifying the primary trend of the stock market developed by Charles Dow. A key step is to compare the direction of the Dow Jones Industrial Average (DJIA) and the Dow Jones Transportation Average (DJTA) and only follow trends where both are moving in the same direction. Volume is a confirmatory criteria. The theory uses elements of peak and trough analysis. Dow’s theory posits three trend phases: accumulation, when smart money starts buying or selling; public participation, when the wider public joins in; and distribution, when the smart money exits.

There are a number of ways to trade the DJIA. One is to use ETFs which allow investors to trade the DJIA as a single security, rather than having to buy shares in all 30 constituent companies. A leading example is the SPDR Dow Jones Industrial Average ETF (DIA). DJIA futures contracts enable traders to speculate on the future value of the index and Options provide the right, but not the obligation, to buy or sell the index at a predetermined price in the future. Mutual funds enable investors to buy a share of a diversified portfolio of DJIA stocks thus providing exposure to the overall index.


Disclaimer: For information purposes only. Past performance is not indicative of future results.
placeholder
Bitcoin CME gaps at $35,000, $27,000 and $21,000, which one gets filled first?Prioritize filling the $27,000 gap and even try higher.
Author  FXStreet
Aug 22, 2023
Prioritize filling the $27,000 gap and even try higher.
placeholder
Why a Quiet 2025 Signals a Massive 2026 Crypto Bull Run: Bitwise CIO ExplainsBitwise's Matt Hougan Predicts a Crypto Boom in 2026 Amid Current Market Struggles
Author  Mitrade
Nov 13, Thu
Bitwise's Matt Hougan Predicts a Crypto Boom in 2026 Amid Current Market Struggles
placeholder
Gold Price Forecast: XAU/USD recovers above $4,100, hawkish Fed might cap gainsGold price (XAU/USD) recovers some lost ground to near $4,105, snapping the two-day losing streak during the early European session on Friday. The precious metal edges higher on the softer US Dollar (USD).  Traders will take more cues from the Fedspeak later on Monday.
Author  FXStreet
23 hours ago
Gold price (XAU/USD) recovers some lost ground to near $4,105, snapping the two-day losing streak during the early European session on Friday. The precious metal edges higher on the softer US Dollar (USD).  Traders will take more cues from the Fedspeak later on Monday.
placeholder
Bitcoin slides deeper into red as bears lean on $96,600 wall and eye $90,000Bitcoin extends its decline after failing to reclaim $96,500, trading below $95,000, the 100-hour SMA and a bearish trend line near $96,600; unless bulls can force a decisive close back above $96,600–$97,200, the short-term path of least resistance stays lower, with $92,500, $90,000 and the main $88,500 support zone in focus.
Author  Mitrade
21 hours ago
Bitcoin extends its decline after failing to reclaim $96,500, trading below $95,000, the 100-hour SMA and a bearish trend line near $96,600; unless bulls can force a decisive close back above $96,600–$97,200, the short-term path of least resistance stays lower, with $92,500, $90,000 and the main $88,500 support zone in focus.
placeholder
Bitcoin briefly loses 2025 gains as crypto plunges over the weekend.Bitcoin experienced a sharp decline this weekend, briefly erasing its 2025 gains and dipping below its year-opening value of $93,507. The cryptocurrency fell to a low of $93,029 on Sunday, representing a 25% drop from its all-time high in October. Although it has rebounded slightly to around $94,209, the pressures on the market remain significant. The downturn occurred despite the reopening of the U.S. government on Thursday, which many had hoped would provide essential support for crypto markets. This year initially appeared promising for cryptocurrencies, particularly after the inauguration of President Donald Trump, who has established the most pro-crypto administration thus far. However, ongoing political tensions—including Trump's tariff strategies and the recent government shutdown, lasting a historic 43 days—have contributed to several rapid price pullbacks for Bitcoin throughout the year. Market dynamics are also being influenced by Bitcoin whales—investors holding large amounts of Bitcoin—who have been offloading portions of their assets, consequently stalling price rallies even as positive regulatory developments emerge. Despite these sell-offs, analysts from Glassnode argue that this behavior aligns with typical patterns seen among long-term investors during the concluding stages of bull markets, suggesting it is not indicative of a mass exodus. Notably, Bitcoin is not alone in its struggles, as Ethereum and Solana have also recorded declines of 7.95% and 28.3%, respectively, since the start of the year, while numerous altcoins have faced even steeper losses. Looking ahead, questions linger regarding the viability of the four-year cycle thesis, particularly given the increasing institutional support and regulatory frameworks now in place in the crypto landscape. Matt Hougan, chief investment officer at Bitwise, remains optimistic, suggesting a potential Bitcoin resurgence in 2026 driven by the “debasement trade” thesis and a broader trend toward increased adoption of stablecoins, tokenization, and decentralized finance. Hougan emphasized the soundness of the underlying fundamentals, pointing to a positive outlook for the sector in the longer term.
Author  Mitrade
21 hours ago
Bitcoin experienced a sharp decline this weekend, briefly erasing its 2025 gains and dipping below its year-opening value of $93,507. The cryptocurrency fell to a low of $93,029 on Sunday, representing a 25% drop from its all-time high in October. Although it has rebounded slightly to around $94,209, the pressures on the market remain significant. The downturn occurred despite the reopening of the U.S. government on Thursday, which many had hoped would provide essential support for crypto markets. This year initially appeared promising for cryptocurrencies, particularly after the inauguration of President Donald Trump, who has established the most pro-crypto administration thus far. However, ongoing political tensions—including Trump's tariff strategies and the recent government shutdown, lasting a historic 43 days—have contributed to several rapid price pullbacks for Bitcoin throughout the year. Market dynamics are also being influenced by Bitcoin whales—investors holding large amounts of Bitcoin—who have been offloading portions of their assets, consequently stalling price rallies even as positive regulatory developments emerge. Despite these sell-offs, analysts from Glassnode argue that this behavior aligns with typical patterns seen among long-term investors during the concluding stages of bull markets, suggesting it is not indicative of a mass exodus. Notably, Bitcoin is not alone in its struggles, as Ethereum and Solana have also recorded declines of 7.95% and 28.3%, respectively, since the start of the year, while numerous altcoins have faced even steeper losses. Looking ahead, questions linger regarding the viability of the four-year cycle thesis, particularly given the increasing institutional support and regulatory frameworks now in place in the crypto landscape. Matt Hougan, chief investment officer at Bitwise, remains optimistic, suggesting a potential Bitcoin resurgence in 2026 driven by the “debasement trade” thesis and a broader trend toward increased adoption of stablecoins, tokenization, and decentralized finance. Hougan emphasized the soundness of the underlying fundamentals, pointing to a positive outlook for the sector in the longer term.
goTop
quote