


Dow Jones Industrial Average falls on pullback Wednesday
- The Dow Jones tilted into the bearish side, falling 300 points.
- Exhaustion plays are on the cards with indexes deep in overbought territory.
- Despite a trim off the top, the Dow Jones is on pace for another record month.
The Dow Jones Industrial Average (DJIA) pulled back on Wednesday, shedding around 300 points and easing back below the 42,000 handle as the heavyweight equity index takes a breather after a period of repeated breaks into record territory.
Treasury yields ticked higher on Wednesday and most of the US indexes are testing into the red, with the Dow Jones taking the brunt of the damage, falling 0.8% through the US trading session. Market focus is shifting back to the state of the US economy following the Federal Reserve’s (Fed) bumper 50 bps rate cut last week.
US consumer confidence indicators fell this week as the average US consumer doesn’t share in the stock market’s exuberance over Fed rate cuts, with key confidence readings falling to their lowest levels in three years and consumer inflation expectations for the next 12 months ticking higher. This Friday will see a fresh update to US Personal Consumption Expenditure (PCE) inflation figures.
New home sales also fell in August, declining 4.7% to 716K from the previous month’s revised 751K. Meanwhile, investors will see another print of US Gross Domestic Product (GDP) growth for the second quarter, expected to hold steady at 3.0% on an annualized basis. Thursday will also bring a slew of speeches and public appearances from several Fed officials, including Fed Chair Jerome Powell.
Dow Jones news
Most of the Dow Jones equity index tilted into the red on Wednesday, with around two-thirds of the stock board easing for the day. Intel (INTC) still managed to extend a near-term rally, stretching another 2.5% to $23.40 per share, but the battered chipmaker still remains down over 53% YTD.
Amgen (AMGN) tumbled nearly 5% on Wednesday, dragging the Dow Jones lower overall and fell below $315 per share for the second time since the beginning of August. The pharmaceutical company’s recent exploration into a new eczema drug called rocatinlimab yielded results that undershot efficacy expectations, and also underperformed competitors’ products that already exist for treating atopic dermatitis.
Dow Jones price forecast
Wednesday’s bearish performance for the Dow Jones puts the index at risk of closing in the red for the week as over-exerted buyers run out of gas and give short pressure a chance to build back up. However, despite a near-term snap, the index is still planted firmly in the long side of the trend, and a buildup of short positions could give way to a snap back into record chart territory.
If the bears win the near-term tug-of-war, the Dow Jones could backslide to the 50-day Exponential Moving Average (EMA) near 40,800.
Dow Jones daily chart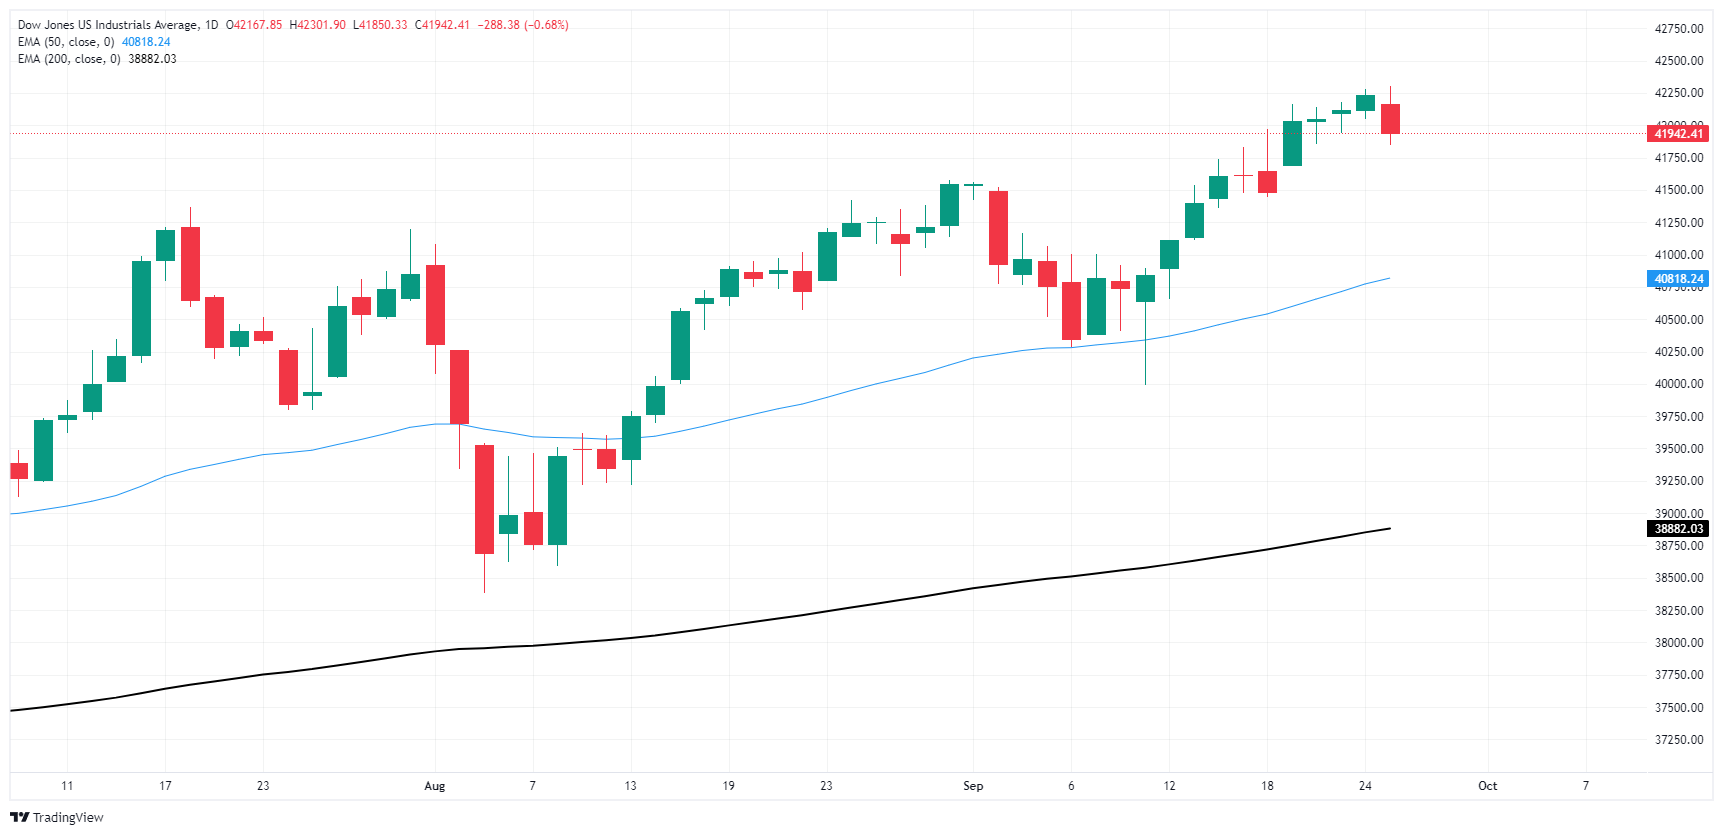
Dow Jones FAQs
The Dow Jones Industrial Average, one of the oldest stock market indices in the world, is compiled of the 30 most traded stocks in the US. The index is price-weighted rather than weighted by capitalization. It is calculated by summing the prices of the constituent stocks and dividing them by a factor, currently 0.152. The index was founded by Charles Dow, who also founded the Wall Street Journal. In later years it has been criticized for not being broadly representative enough because it only tracks 30 conglomerates, unlike broader indices such as the S&P 500.
Many different factors drive the Dow Jones Industrial Average (DJIA). The aggregate performance of the component companies revealed in quarterly company earnings reports is the main one. US and global macroeconomic data also contributes as it impacts on investor sentiment. The level of interest rates, set by the Federal Reserve (Fed), also influences the DJIA as it affects the cost of credit, on which many corporations are heavily reliant. Therefore, inflation can be a major driver as well as other metrics which impact the Fed decisions.
Dow Theory is a method for identifying the primary trend of the stock market developed by Charles Dow. A key step is to compare the direction of the Dow Jones Industrial Average (DJIA) and the Dow Jones Transportation Average (DJTA) and only follow trends where both are moving in the same direction. Volume is a confirmatory criteria. The theory uses elements of peak and trough analysis. Dow’s theory posits three trend phases: accumulation, when smart money starts buying or selling; public participation, when the wider public joins in; and distribution, when the smart money exits.
There are a number of ways to trade the DJIA. One is to use ETFs which allow investors to trade the DJIA as a single security, rather than having to buy shares in all 30 constituent companies. A leading example is the SPDR Dow Jones Industrial Average ETF (DIA). DJIA futures contracts enable traders to speculate on the future value of the index and Options provide the right, but not the obligation, to buy or sell the index at a predetermined price in the future. Mutual funds enable investors to buy a share of a diversified portfolio of DJIA stocks thus providing exposure to the overall index.
Recommended Articles


