


US Dollar sets forth weekly losing streak but NFP holds key
- The US Dollar falls for a third day in a row.
- Investors are cautious ahead of the Nonfarm Payrolls report, which could trigger volatility around the US Dollar.
- The US Dollar Index retreats further, nearing the August low at 100.62.
The US Dollar (USD) trades slightly on the back foot on Friday as markets brace for potentially the most volatile event of the week, Nonfarm Payrolls (NFP). Markets are increasingly considering the possibility that the US Federal Reserve (Fed) could opt for a big interest-rate cut compared with the beginning of the week after a streak of labor-market-related data came weaker than expected. A big miss in the Nonfarm Payrolls number will confirm this stance, while a big beat on estimates might see a spicy outcome, with the US Dollar rallying and rate cut bets being quickly unwound.
The Nonfarm Payrolls print will be the main element together with the Unemployment Rate and the monthly Average Hourly Earnings. However, the surprise might come right at the end of the trading day with Federal Reserve Governor Christopher Waller due to speak after the Nonfarm Payrolls print is published. Fed Waller is known for delivering some market-moving comments, and he might be the one to confirm if in September the Fed will go for a 25-basis-point or a 50-basis-point rate cut.
Daily digest market movers: All eyes on payrolls
- At 12:30 GMT, the US Jobs Report for August will be released by the Bureau of Labor Statistics. Here are the main key takeaways to watch:
- Nonfarm Payrolls are expected to have increased by 160,000, accelerating from the tepid 114,000 seen a month earlier.
- Monthly Average Hourly Earnings should tick up to 0.3% from 0.2%.
- The Unemployment Rate should dip to 4.2% from 4.3%.
- Two Fed speakers are on the docket after the US Jobs Report is published:
- Federal Reserve Bank of New York President John Williams delivers keynote remarks and participates in a Q&A session at the C. Peter McColough Series on International Economics around 12:45 GMT.
- Around 15:00 GMT, Federal Reserve Governor Christopher Waller delivers a speech about the US economic outlook and participates in a Q&A session at the University of Notre Dame in Indiana.
- Equities are trading lower again, with Asia already closing off this week’s performance in red. Both European and US equities are also losing ground, although by less than 1%.
- The CME Fedwatch Tool shows a 59.0% chance of a 25 basis points (bps) interest rate cut by the Fed in September against a 41.0% chance for a 50 bps cut. Another 25 bps cut (if September is a 25 bps cut) is expected in November by 29.9%, while there is a 49.9% chance that rates will be 75 bps (25 bps + 50 bps) below the current levels and a 20.2% probability of rates being 100 (25 bps + 75 bps) basis points lower.
- The US 10-year benchmark rate trades at 3.70%, close to the lowest level for this year at 3.66%.
Economic Indicator
Nonfarm Payrolls
The Nonfarm Payrolls release presents the number of new jobs created in the US during the previous month in all non-agricultural businesses; it is released by the US Bureau of Labor Statistics (BLS). The monthly changes in payrolls can be extremely volatile. The number is also subject to strong reviews, which can also trigger volatility in the Forex board. Generally speaking, a high reading is seen as bullish for the US Dollar (USD), while a low reading is seen as bearish, although previous months' reviews and the Unemployment Rate are as relevant as the headline figure. The market's reaction, therefore, depends on how the market assesses all the data contained in the BLS report as a whole.
Read more.Next release: Fri Sep 06, 2024 12:30
Frequency: Monthly
Consensus: 160K
Previous: 114K
Source: US Bureau of Labor Statistics
America’s monthly jobs report is considered the most important economic indicator for forex traders. Released on the first Friday following the reported month, the change in the number of positions is closely correlated with the overall performance of the economy and is monitored by policymakers. Full employment is one of the Federal Reserve’s mandates and it considers developments in the labor market when setting its policies, thus impacting currencies. Despite several leading indicators shaping estimates, Nonfarm Payrolls tend to surprise markets and trigger substantial volatility. Actual figures beating the consensus tend to be USD bullish.
US Dollar Index Technical Analysis: We get it by now
The US Dollar Index (DXY) is the sum of all parts that are taking place in the markets. Investors increasingly price in that the Fed will need to cut interest rates by more than what was anticipated a few weeks ago. Although a rate cut might be granted, the recent US economic data still puts the economy on a glide path for a soft landing, which means the Fed isn’t likely to cut aggressively as that would risk sparking inflation again.
Looking at key technical levels, the first resistance at 101.90 is starting to look very difficult to break through after it already triggered a rejection earlier this week. Further up, a steep 2% uprising would be needed to get the index to 103.18. Finally, a heavy resistance level near 104.00 not only holds a pivotal technical value, but it also bears the 200-day Simple Moving Average (SMA) as the second heavyweight to cap price action.
On the downside, 100.62 (the low from December 28) could soon see a test in case data supports more rate cuts from the Fed. Should it break, the low from July 14, 2023, at 99.58, will be the ultimate level to look out for. Once that level gives way, early levels from 2023 are coming in near 97.73.
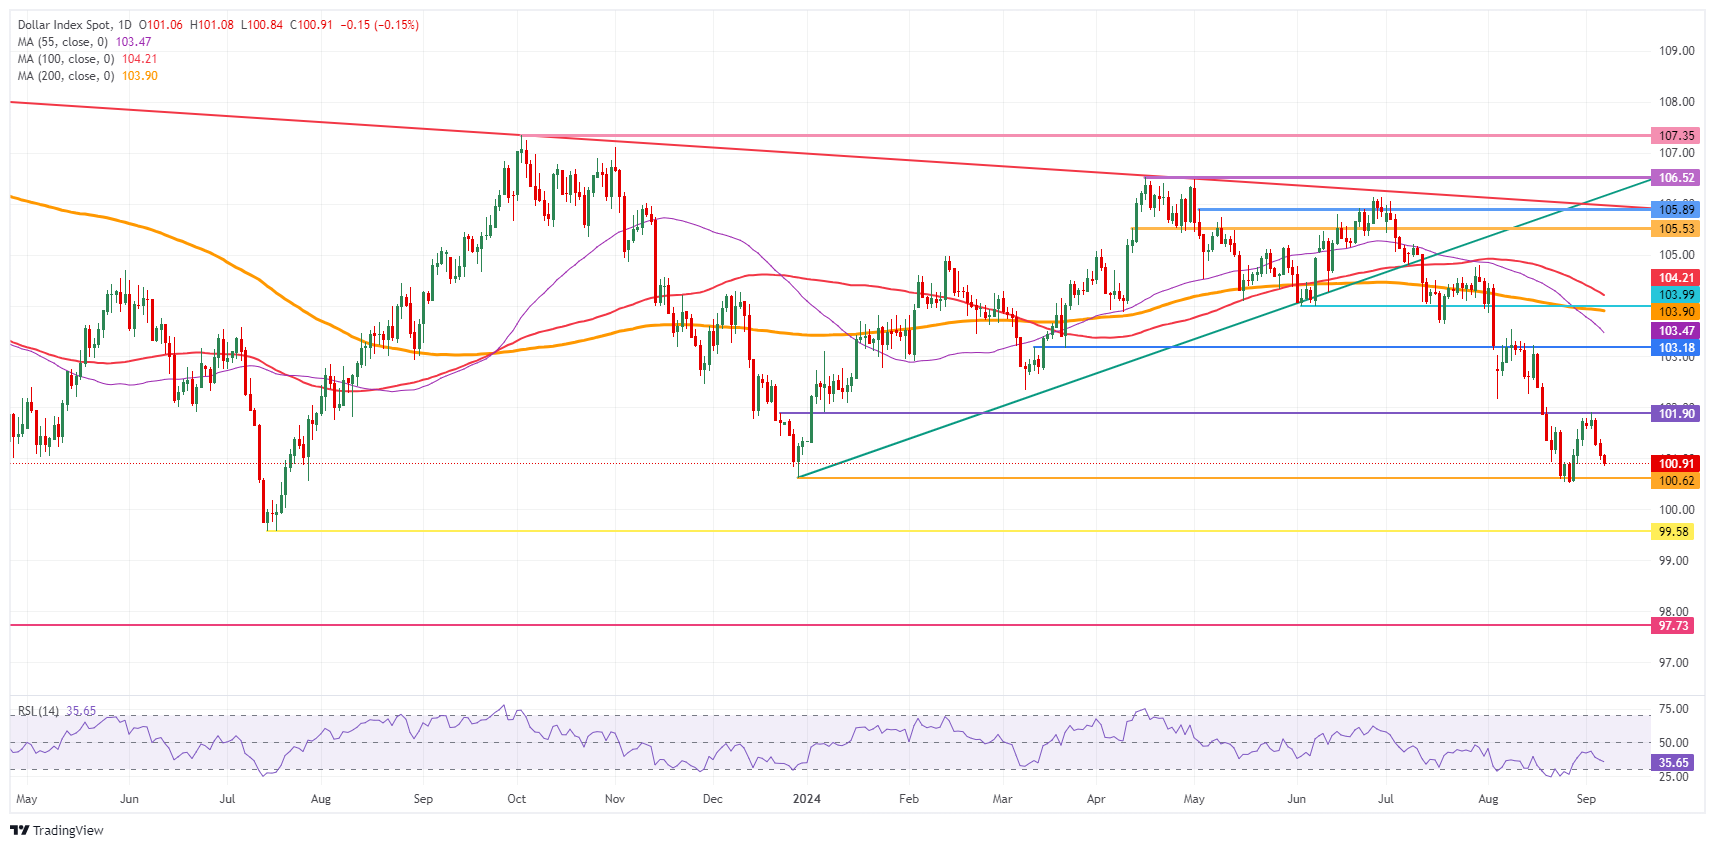
US Dollar Index: Daily Chart
Recommended Articles


