Dow Jones Industrial Average tests new all-time high but struggling with 40,000

Source Fxstreet
  • Dow Jones briefly tipped into a new record high, but cautious tones remain.
  • Fedspeak dominates headlines on quiet Monday, risk appetite hesitates.
  • Rate markets still bet on September rate cut, but odds are easing.

The Dow Jones Industrial Average (DJIA) tested into a new all-time record high on Monday, but price action is getting pushed into the middle near the 40,000.00 handle. Federal Reserve (Fed) officials are appearing in force to kick off the new week, with a slew of policymakers giving cautious comments on Monday. Further comments from Fed officials are expected on Tuesday.

Key inflation data eased slightly below expectations last week, pinning broad-market hopes for Fed rate cuts higher. Despite a better-than-expected inflation print last week, price growth remains well above the Fed’s 2% annualized target. Key Fed members remain concerned that progress on inflation may be stalling out.

Read more: Fed officials speak cautiously on policy outlook after April inflation report

The latest Meeting Minutes from the Fed’s Federal Open Market Committee (FOMC) will be published this week, followed by US Purchasing Managers Index (PMI) figures. New and used Home Sales as well as Durable Goods are due later in the week. 

The CME’s FedWatch Tool shows rate markets are still pricing in at least 25 basis points in rate cuts from the September Fed rate meeting, but odds are slipping back. At current cut, rate traders are pricing in around 63% odds of a quarter-point cut in September.

Dow Jones news

Over half of the constituent equities that make up the Dow Jones are in the red on Monday, with JPMorgan Chase & Co. (JPM) leading the losers lower, backsliding -2.7% and falling below $200 per share. JPM is pulling back after hitting a new 52-week high near $205.00 recently.

On the high side, Caterpillar Inc. (CAD) rose 1.7% to $362.40 per share. Caterpillar was closely followed by Boeing Co. (BA), which rose 1.45% to $362.50 per share.

Dow Jones technical outlook

The Dow Jones clipped into a fresh all-time high of 40,070.82 on Monday before cautious investors dragged the mega cap index back down to 39,900.00. Despite softening bids to kick off the new trading week, the DJIA remains firmly-planted in bull country.

The Dow Jones is still up nearly 6% in 2024, and is trading well above the 200-day Exponential Moving Average (EMA) at 37,090.37. 

Dow Jones five-minute chart

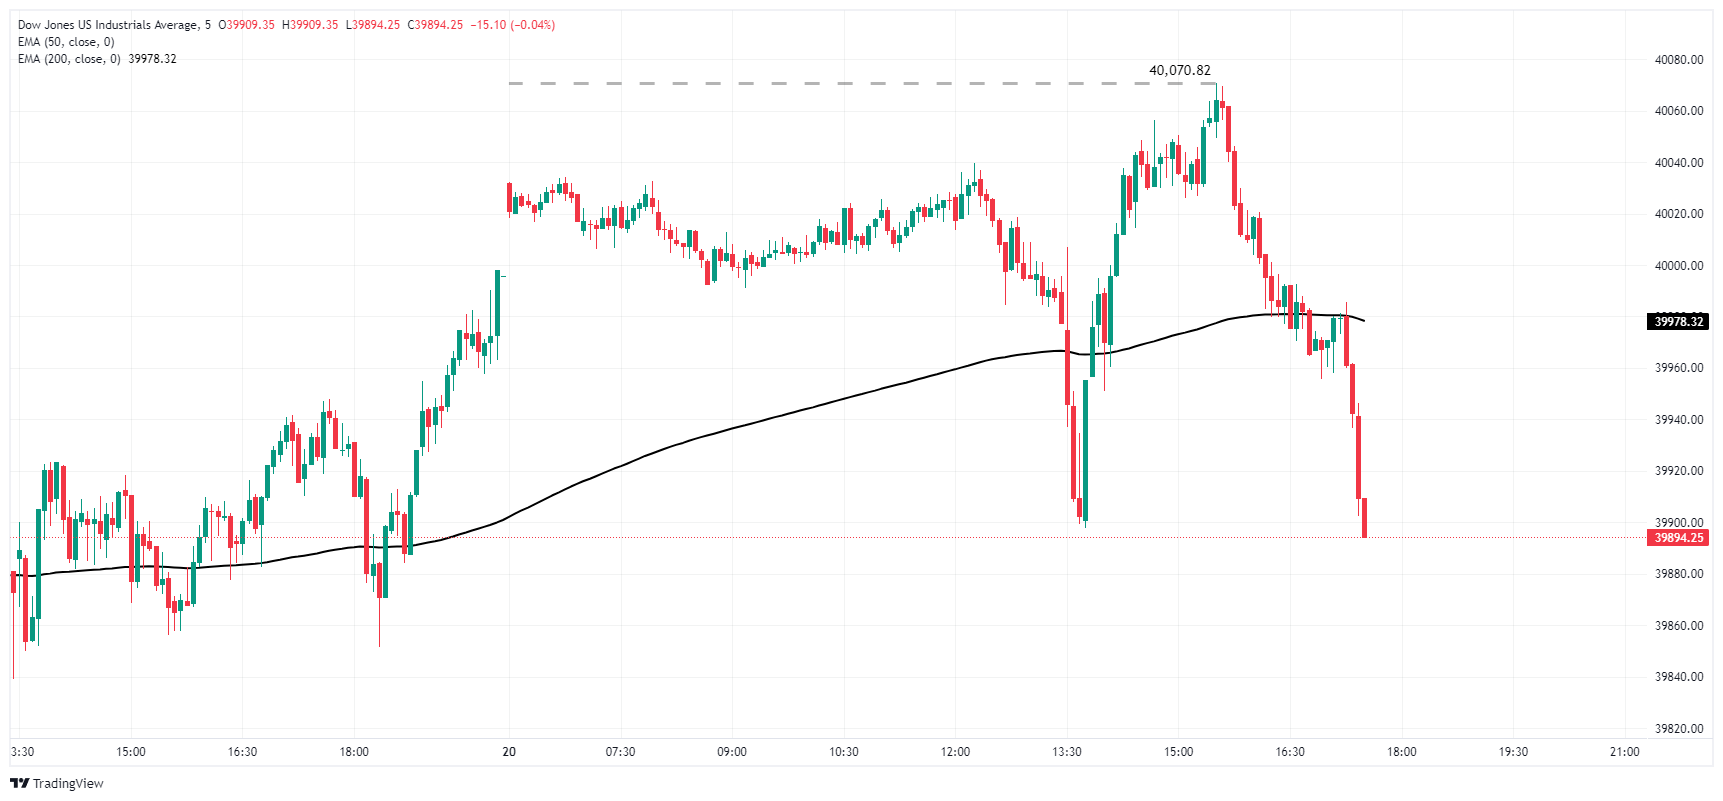
Dow Jones daily chart
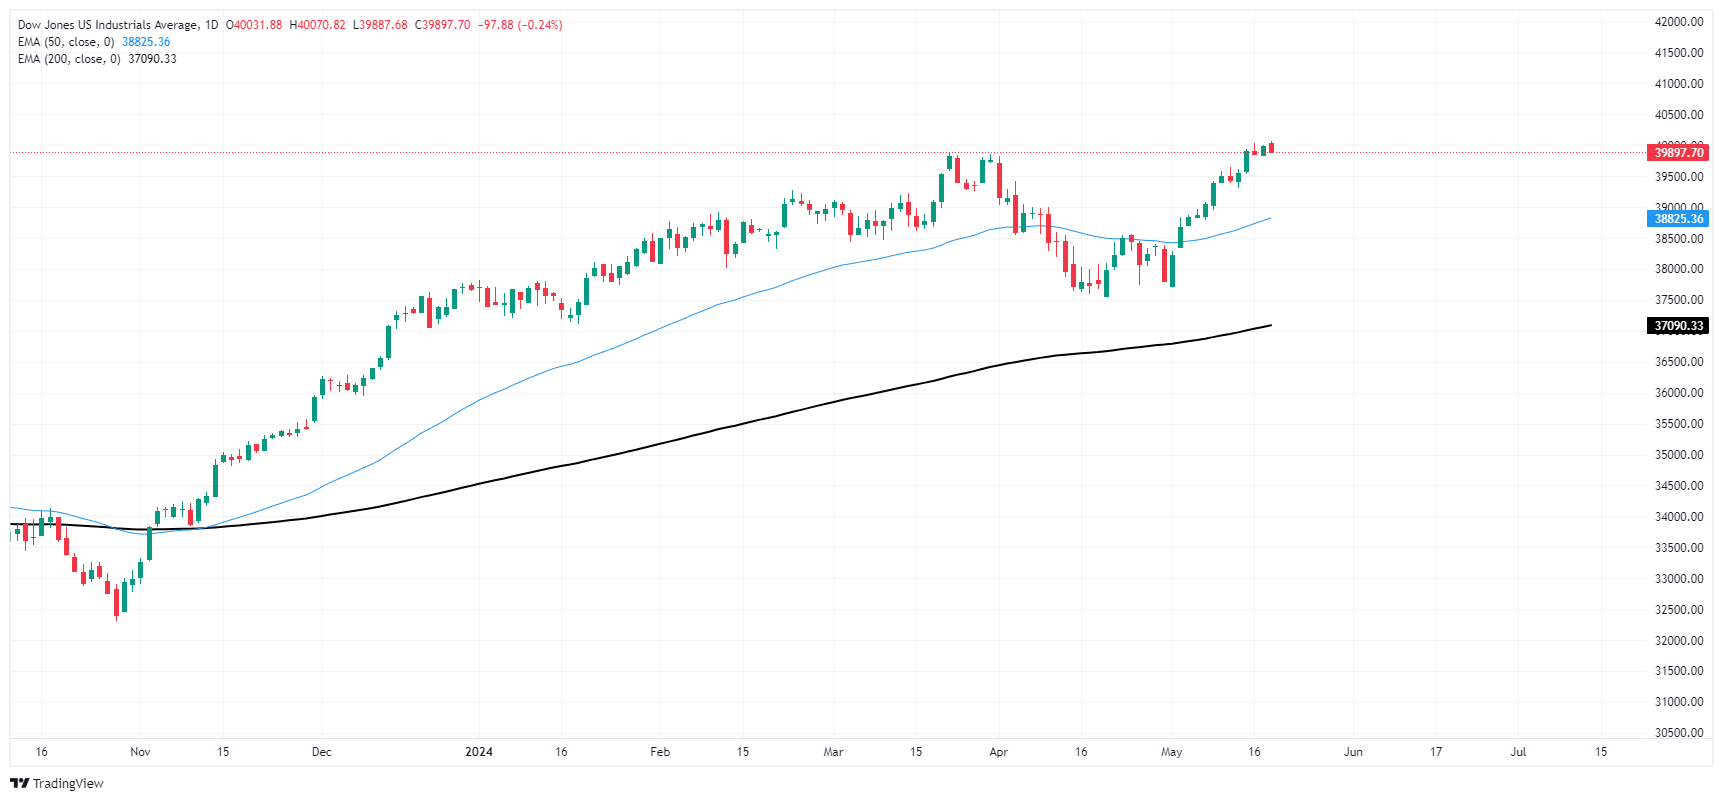
Dow Jones FAQs

The Dow Jones Industrial Average, one of the oldest stock market indices in the world, is compiled of the 30 most traded stocks in the US. The index is price-weighted rather than weighted by capitalization. It is calculated by summing the prices of the constituent stocks and dividing them by a factor, currently 0.152. The index was founded by Charles Dow, who also founded the Wall Street Journal. In later years it has been criticized for not being broadly representative enough because it only tracks 30 conglomerates, unlike broader indices such as the S&P 500.

Many different factors drive the Dow Jones Industrial Average (DJIA). The aggregate performance of the component companies revealed in quarterly company earnings reports is the main one. US and global macroeconomic data also contributes as it impacts on investor sentiment. The level of interest rates, set by the Federal Reserve (Fed), also influences the DJIA as it affects the cost of credit, on which many corporations are heavily reliant. Therefore, inflation can be a major driver as well as other metrics which impact the Fed decisions.

Dow Theory is a method for identifying the primary trend of the stock market developed by Charles Dow. A key step is to compare the direction of the Dow Jones Industrial Average (DJIA) and the Dow Jones Transportation Average (DJTA) and only follow trends where both are moving in the same direction. Volume is a confirmatory criteria. The theory uses elements of peak and trough analysis. Dow’s theory posits three trend phases: accumulation, when smart money starts buying or selling; public participation, when the wider public joins in; and distribution, when the smart money exits.

There are a number of ways to trade the DJIA. One is to use ETFs which allow investors to trade the DJIA as a single security, rather than having to buy shares in all 30 constituent companies. A leading example is the SPDR Dow Jones Industrial Average ETF (DIA). DJIA futures contracts enable traders to speculate on the future value of the index and Options provide the right, but not the obligation, to buy or sell the index at a predetermined price in the future. Mutual funds enable investors to buy a share of a diversified portfolio of DJIA stocks thus providing exposure to the overall index.


Disclaimer: For information purposes only. Past performance is not indicative of future results.
placeholder
Bitcoin's 2025 Gains Erased: Who Ended the BTC Bull Market?After slumping below $93,500, 2025 Bitcoin price gains have been completely wiped out. Investors are puzzled as to why its bull market, underpinned by political tailwinds, institutionaliz
Author  TradingKey
12 hours ago
After slumping below $93,500, 2025 Bitcoin price gains have been completely wiped out. Investors are puzzled as to why its bull market, underpinned by political tailwinds, institutionaliz
placeholder
Oil Extends Losses as Russian Port Resumes Operations, Easing Supply FearsOil prices fell further on Monday as market participants reacted to signs of resumed activity at Russia’s key Novorossiysk export terminal on the Black Sea, easing concerns over a prolonged supply disruption after a Ukrainian drone strike last week.
Author  Mitrade
16 hours ago
Oil prices fell further on Monday as market participants reacted to signs of resumed activity at Russia’s key Novorossiysk export terminal on the Black Sea, easing concerns over a prolonged supply disruption after a Ukrainian drone strike last week.
placeholder
Bitcoin slides deeper into red as bears lean on $96,600 wall and eye $90,000Bitcoin extends its decline after failing to reclaim $96,500, trading below $95,000, the 100-hour SMA and a bearish trend line near $96,600; unless bulls can force a decisive close back above $96,600–$97,200, the short-term path of least resistance stays lower, with $92,500, $90,000 and the main $88,500 support zone in focus.
Author  Mitrade
19 hours ago
Bitcoin extends its decline after failing to reclaim $96,500, trading below $95,000, the 100-hour SMA and a bearish trend line near $96,600; unless bulls can force a decisive close back above $96,600–$97,200, the short-term path of least resistance stays lower, with $92,500, $90,000 and the main $88,500 support zone in focus.
placeholder
Bitcoin briefly loses 2025 gains as crypto plunges over the weekend.Bitcoin experienced a sharp decline this weekend, briefly erasing its 2025 gains and dipping below its year-opening value of $93,507. The cryptocurrency fell to a low of $93,029 on Sunday, representing a 25% drop from its all-time high in October. Although it has rebounded slightly to around $94,209, the pressures on the market remain significant. The downturn occurred despite the reopening of the U.S. government on Thursday, which many had hoped would provide essential support for crypto markets. This year initially appeared promising for cryptocurrencies, particularly after the inauguration of President Donald Trump, who has established the most pro-crypto administration thus far. However, ongoing political tensions—including Trump's tariff strategies and the recent government shutdown, lasting a historic 43 days—have contributed to several rapid price pullbacks for Bitcoin throughout the year. Market dynamics are also being influenced by Bitcoin whales—investors holding large amounts of Bitcoin—who have been offloading portions of their assets, consequently stalling price rallies even as positive regulatory developments emerge. Despite these sell-offs, analysts from Glassnode argue that this behavior aligns with typical patterns seen among long-term investors during the concluding stages of bull markets, suggesting it is not indicative of a mass exodus. Notably, Bitcoin is not alone in its struggles, as Ethereum and Solana have also recorded declines of 7.95% and 28.3%, respectively, since the start of the year, while numerous altcoins have faced even steeper losses. Looking ahead, questions linger regarding the viability of the four-year cycle thesis, particularly given the increasing institutional support and regulatory frameworks now in place in the crypto landscape. Matt Hougan, chief investment officer at Bitwise, remains optimistic, suggesting a potential Bitcoin resurgence in 2026 driven by the “debasement trade” thesis and a broader trend toward increased adoption of stablecoins, tokenization, and decentralized finance. Hougan emphasized the soundness of the underlying fundamentals, pointing to a positive outlook for the sector in the longer term.
Author  Mitrade
20 hours ago
Bitcoin experienced a sharp decline this weekend, briefly erasing its 2025 gains and dipping below its year-opening value of $93,507. The cryptocurrency fell to a low of $93,029 on Sunday, representing a 25% drop from its all-time high in October. Although it has rebounded slightly to around $94,209, the pressures on the market remain significant. The downturn occurred despite the reopening of the U.S. government on Thursday, which many had hoped would provide essential support for crypto markets. This year initially appeared promising for cryptocurrencies, particularly after the inauguration of President Donald Trump, who has established the most pro-crypto administration thus far. However, ongoing political tensions—including Trump's tariff strategies and the recent government shutdown, lasting a historic 43 days—have contributed to several rapid price pullbacks for Bitcoin throughout the year. Market dynamics are also being influenced by Bitcoin whales—investors holding large amounts of Bitcoin—who have been offloading portions of their assets, consequently stalling price rallies even as positive regulatory developments emerge. Despite these sell-offs, analysts from Glassnode argue that this behavior aligns with typical patterns seen among long-term investors during the concluding stages of bull markets, suggesting it is not indicative of a mass exodus. Notably, Bitcoin is not alone in its struggles, as Ethereum and Solana have also recorded declines of 7.95% and 28.3%, respectively, since the start of the year, while numerous altcoins have faced even steeper losses. Looking ahead, questions linger regarding the viability of the four-year cycle thesis, particularly given the increasing institutional support and regulatory frameworks now in place in the crypto landscape. Matt Hougan, chief investment officer at Bitwise, remains optimistic, suggesting a potential Bitcoin resurgence in 2026 driven by the “debasement trade” thesis and a broader trend toward increased adoption of stablecoins, tokenization, and decentralized finance. Hougan emphasized the soundness of the underlying fundamentals, pointing to a positive outlook for the sector in the longer term.
placeholder
Gold Price Forecast: XAU/USD recovers above $4,100, hawkish Fed might cap gainsGold price (XAU/USD) recovers some lost ground to near $4,105, snapping the two-day losing streak during the early European session on Friday. The precious metal edges higher on the softer US Dollar (USD).  Traders will take more cues from the Fedspeak later on Monday.
Author  FXStreet
21 hours ago
Gold price (XAU/USD) recovers some lost ground to near $4,105, snapping the two-day losing streak during the early European session on Friday. The precious metal edges higher on the softer US Dollar (USD).  Traders will take more cues from the Fedspeak later on Monday.
goTop
quote