

Solana Price Forecast: ETF Demand and Derivatives Flows Fuel a Sharper Rebound

- Trump's Account May Contain BTC. US President Proposes Another Bitcoin Policy, Just Another Political Talk Show?
- Gold declines as Trump scraps Iran memorandum, markets await Fed minutes
- US President Trump: I think MoU with Iran is over
- Gold slides back closer to $4,050 as Iran risks and Fed hike bets boost USD
- WTI Crude Oil Price Forecast: US-Iran Conflict Reignites, Will a New Round of Oil Price Rises Begin?
- Gold recovers above $4,100 as traders assess US-Iran conflict
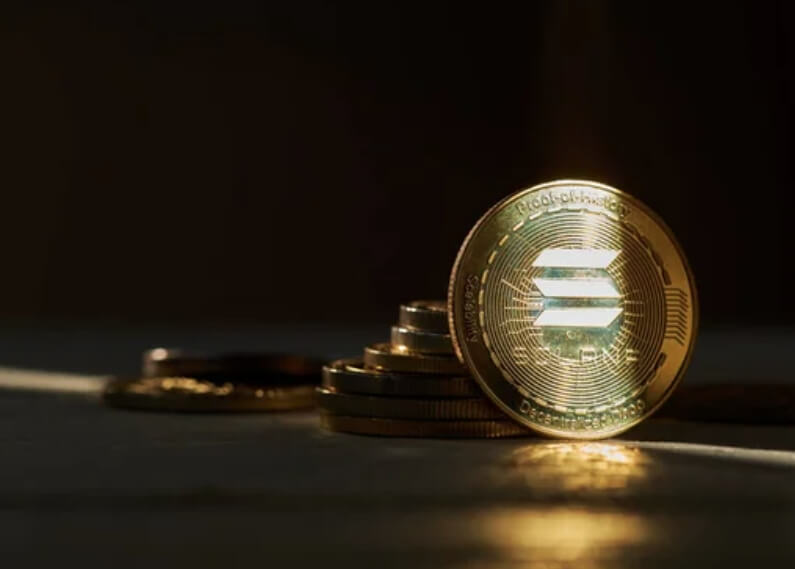
Solana has extended its rebound from Tuesday, trading above $140 on Wednesday and eyeing a move toward the 50-day EMA around $157–$158.
ETF inflows have flipped sharply positive, while futures open interest is rising, pointing to a renewed appetite for risk across both spot and derivatives markets.
On-chain data show TVL and stablecoin liquidity climbing, reinforcing the case that Solana’s recovery is being driven by real usage, not just short-term speculation.
Solana (SOL) is catching a bid again. By press time on Wednesday, the token is trading above $140, up more than 10% over the past 24 hours, as Vanguard’s suite of crypto-focused Exchange Traded Funds (ETFs) — which includes Solana products — helps pull fresh attention back into the asset. The rebound extends roughly 9% in gains from Tuesday and has put a potential double-bottom pattern in play on the charts, with bulls now looking toward the 50-day Exponential Moving Average (EMA) as the next target.
Demand returns for Solana across ETFs, derivatives and on-chain activity
On the fund side, the tone has shifted quickly. Vanguard’s crypto ETFs covering Bitcoin (BTC), Ethereum (ETH), Solana (SOL) and Ripple (XRP) are adding some institutional heft to what had recently been a tired market. For Solana specifically, ETF flows have swung from caution back to accumulation: a net inflow of $45.77 million on Tuesday followed a net outflow of $13.55 million on Monday, a two-day flip that typically signals investors are once again willing to buy dips rather than sell strength.

That shift is echoed in the derivatives market. Data from CoinGlass show Solana futures open interest at $7.26 billion, up 6.75% over the last 24 hours. Rising OI, when paired with higher prices, usually indicates new money is being put to work on the long side rather than just shorts being forced out — in other words, capital is actively choosing to take on more exposure.

Under the surface, the on-chain picture is moving in the same direction. Solana’s Total Value Locked (TVL) has climbed 9.33% in the past 24 hours to $9.013 billion, reflecting fresh deposits across DeFi protocols and signaling higher user engagement. At the same time, stablecoin liquidity on Solana has increased by more than 13% in the last week to $15.181 billion, bolstering the network’s capacity to support trading, lending and yield strategies. For a recovering ecosystem, those are the kind of structural signals that matter more than a single green day on the chart.

Taken together, ETF flows, derivatives positioning and on-chain metrics tell a consistent story: Solana is not just bouncing mechanically; there is renewed demand from both institutional and crypto-native players.
Technical outlook: Is Solana setting up for a breakout?
Technically, SOL has done some important repair work after its latest sell-off. Price bounced cleanly from $126, a level that has held as support since the June 22 low, and crucially avoided a daily close below that band. The resulting move has shaped into a double-bottom pattern, with a neckline sitting near $145, roughly in line with the November 20 high.

From here, the roadmap is relatively straightforward:
A daily close above $145 would confirm the double-bottom breakout and give bulls a stronger footing.
In that scenario, Solana could extend its rally toward the 50-day EMA at $158, and, if momentum holds, on toward the 200-day EMA around $175 as the next major resistance area.
Momentum indicators are moving in the right direction, even if they haven’t fully flipped to “euphoria.” On the daily chart, the Relative Strength Index (RSI) sits at 48, grinding higher from oversold territory and signaling that bearish pressure is easing rather than intensifying. Meanwhile, the Moving Average Convergence Divergence (MACD) is slowly recovering inside negative territory, hinting that downside momentum is bleeding out and leaving room for a more sustained turn if buying pressure persists.
The bear case hasn’t disappeared, it’s just been pushed back. A failure to clear the neckline near $145 — especially if it triggers long liquidations — could drag Solana back into a consolidation range, with the lower band anchored once again around $126. A return to that level would test just how committed the new wave of ETF buyers, futures longs and DeFi users really are.
For now, though, the balance of evidence has shifted. With ETF demand back, derivatives risk being dialed up and on-chain metrics climbing, Solana’s rebound looks less like a random bounce and more like the early stages of a market rebuilding its conviction.
Read more
The above content was completed with the assistance of AI and has been reviewed by an editor.


