


Asia has a violent crypto crime problem, Chainalysis H1 2025 report
Crypto crime numbers in the first half of 2025 have already surpassed all of 2024’s stolen funds, and Asia is reportedly at the center of it all. A mid-year report by blockchain analytics firm Chainalysis released Thursday revealed more than $2.17 billion has been stolen from crypto services, placing this year on course to become the worst in crypto theft history.
Per the software and blockchain security firm’s findings, the biggest contributor to the baffling numbers in stolen funds was the $1.5 billion Bybit hack, linked to North Korea’s Lazarus Group. The breach is the largest individual hack ever recorded in crypto and has already outpaced the group’s total 2024 haul of $1.3 billion.
“If current trends continue, stolen funds from services could eclipse $4 billion by year’s end,” Chainalysis wrote.
Asia tops geographic crime hotspots
Regionally, Eastern Europe, the Middle East and North Africa (MENA), and Central and Southern Asia and Oceania (CSAO) have seen the most rapid growth in victim counts year-over-year.
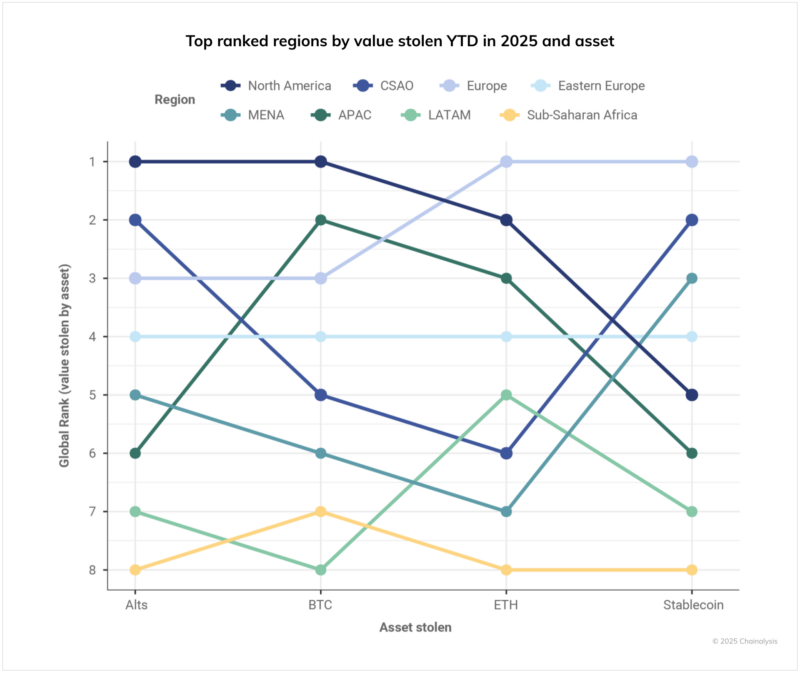
In terms of value stolen, North America leads in both Bitcoin and altcoin theft. Europe ranks first globally in ether and stablecoin theft. Security professionals believe the cases have gone up due to the mass adoption of these assets in both regions, or simply a preference among cybercriminals for liquid and easily transferred tokens.
APAC is second for Bitcoin theft and third for Ethereum, while CSAO holds second place for both altcoin and stablecoin theft. Sub-Saharan Africa is among the lowest in stolen value, which the report deemed was more due to economic factors, less exposure to crypto, than better security.
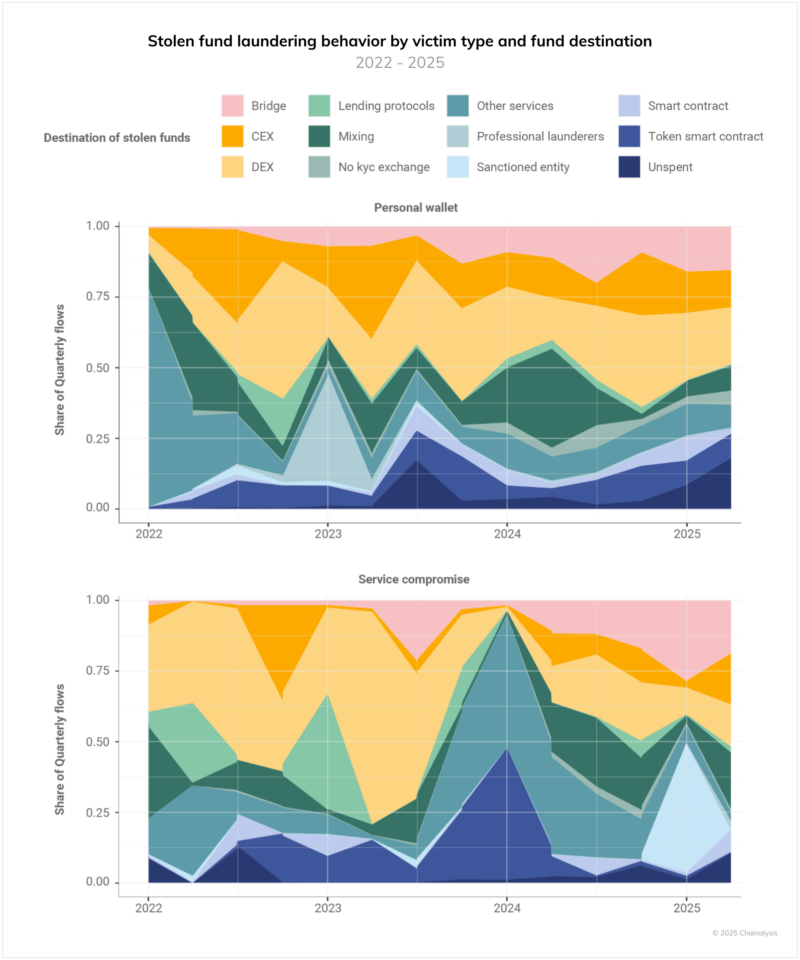
Chainalysis shared a chart showing that Bitcoin wallet holders are more likely to suffer larger financial losses. The number of victims on chains outside the Bitcoin and EVM ecosystems, like Solana, has also ticked upwards.
Half of 2025 breaks record for crypto-related thefts
The Chainalysis report mentioned that year-to-date thefts through June 2025 are already 17% higher than those seen in the first half of 2022, which previously held the record for the worst year with $3.8 billion in total crypto stolen.
“Stolen fund activity stands out as the dominant concern in 2025,” the report stated, adding that other forms of crypto crime have shown mixed trends, but thefts have grown exponentially.
Chainalysis also found that scammers and criminals have changed their focus from major platforms to individual wallet holders. Security at centralized services has been improving, so attackers are now targeting private wallets with what the company has dubbed “more refined methods.”
This trend, the report suggests, relies on AI tools to help perpetrators in phishing, impersonation, and identity theft. Approximately 23.35% of thefts so far in 2025 have been caused by physical violence, including threats, assault, and in some cases, homicide.
The analysis also discussed the threat posed by so-called “wrench attacks,” where attackers use force or coercion to obtain access to a victim’s wallet keys. It also explained that thieves were more likely to up their activities when Bitcoin’s price was treading on the upper side of market volatility.
“The future increase in asset values (and the perception of its future upward movement) may trigger additional opportunistic physical attacks against known crypto holders,” Chainalysis wrote. Still, it reiterated that the “true scale” of such incidents is likely underreported.
Among the cases cited in the report is the March 2025 abduction and murder of Elison Steel CEO Anson Que in the Philippines. Que and his driver were kidnapped in Bulacan and later found dead in Rizal province.
Your crypto news deserves attention - KEY Difference Wire puts you on 250+ top sites
Recommended Articles


