Bitcoin Surrenders $65,000 as Analysts Warn of ‘Structural’ Market Break

coverImg
Source: DepositPhotos
  • Capital Flight: The global crypto market has hemorrhaged over $1 trillion since January 14, averaging a daily loss of $45 billion.

  • Leverage Washout: Bitcoin’s 11% plunge triggered $2.09 billion in liquidations over 24 hours, the most severe flush since October 10.

  • Systemic Weakness: Analysts at The Kobeissi Letters argue the crash is structural, citing thin market depth and a self-reinforcing cycle of sentiment deterioration.

The cryptocurrency market faced a brutal capitulation event on Thursday, with Bitcoin plunging below the $65,000 psychological support level. The flagship asset cratered 11% over a 24-hour window, marking its steepest single-day decline since the infamous leverage flush on October 10.
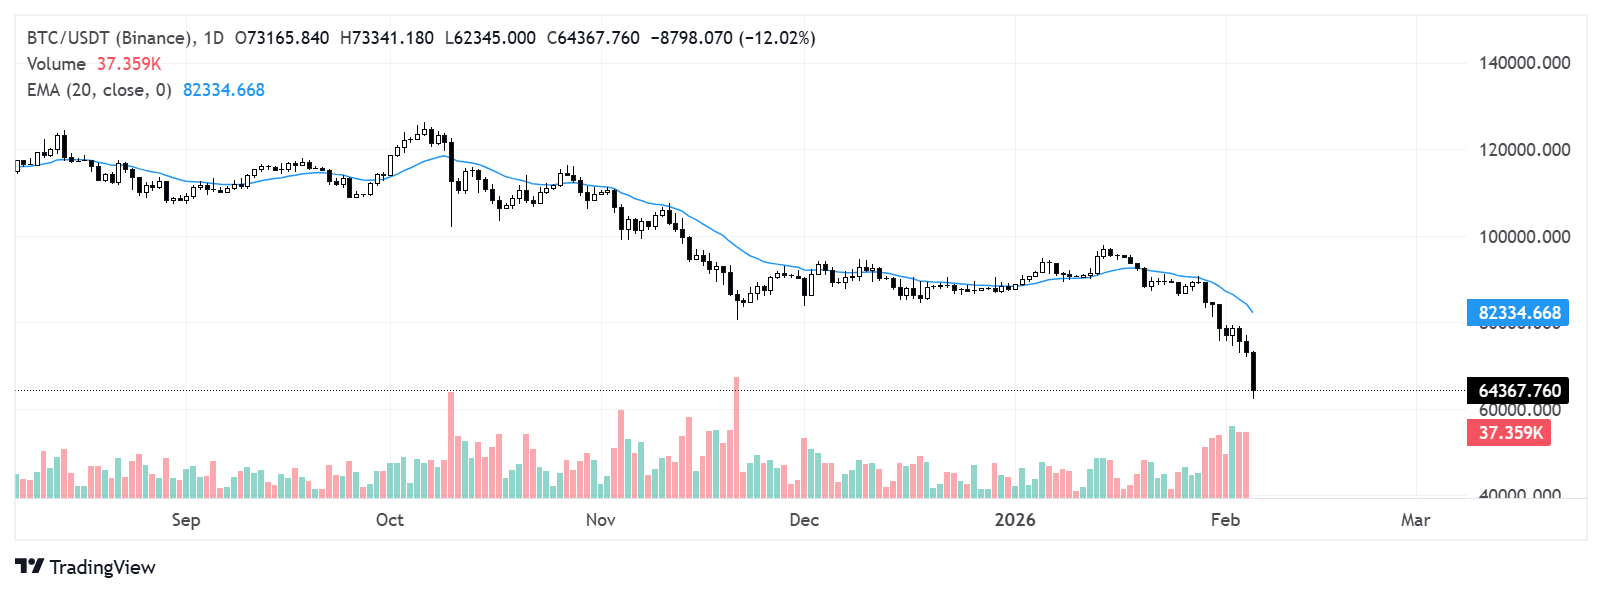
This latest leg down brings Bitcoin’s total retraction to more than 50% since that October pivot, as aggressive selling pressure continues to overwhelm bids.

A trillion-Dollar WipeoutThe carnage was not contained to Bitcoin. The broader digital asset complex has witnessed a staggering destruction of wealth, shedding more than $1 trillion since January 14. This equates to a burn rate of approximately $45 billion per day.

Altcoins bore the brunt of the risk-off sentiment. XRP led the major losers with a 16% nosedive, while Ethereum (ETH), Solana (SOL), and BNB posted double-digit losses of 11%, 11%, and 10%, respectively. Collectively, the total crypto market cap has compressed by nearly 40% since October.

Structural Fragility & The "Virtuous Cycle"According to analysis from The Kobeissi Letters, this is not a standard correction but a "structural" decline. In a Thursday note, analysts observed that the market is trapped in a "virtuous cycle"—a self-reinforcing loop where liquidations drive sentiment lower, which in turn triggers further selling, despite fundamental factors remaining largely unchanged.

A critical vulnerability is market depth, which remains 30% below its October peak. The analysts drew parallels to the liquidity drought seen during the 2022 FTX collapse, noting that "liquidation gaps in crypto are carrying over into equities."

The report suggests today's $9,000 price dislocation likely stemmed from a single institutional player exiting their position into a thin order book.

Liquidation CascadeThe price collapse sparked a massive leverage unwind. Data shows over $2.09 billion in liquidations occurred in just 24 hours. The single largest wreckage was a BTC-USDT position on Binance valued at $12.02 million.

Since January 24, total crypto liquidations have swelled to $10 billion, representing about 55% of the record-breaking volume seen on October 10.

Macro ContagionThe "risk-off" tone reverberated through traditional markets, with the S&P 500 and Nasdaq Composite retreating 1.23% and 1.59%, respectively.

Tech volatility added fuel to the fire. Amazon shares tumbled nearly 11% in after-hours trading following its Q4 earnings release, where the e-commerce giant stunned investors with an estimated capital expenditure forecast of roughly 200 billion for 2026.

Searching for a BottomThe Kobeissi Letters conclude that a true floor will only form once structural liquidity returns. This requires a final "capitulation in price and leverage" paired with peak bearish sentiment.

"We seem to be somewhere near that point," the analysts wrote. At the time of publication, Bitcoin was changing hands around $64,400.

Read more

  • Spot Gold Breaches Four Key Levels, Putting $3,500 at Risk as Technicals Enter Oversold Alert Zone
  • Note: If you want to share the article 《Bitcoin Surrenders $65,000 as Analysts Warn of ‘Structural’ Market Break》, make sure you retain the original link. For more information, please visit Insights or browse www.mitrade.com.

    The above content was completed with the assistance of AI and has been reviewed by an editor.


    goTop
    quote
    Related Articles
    placeholder
    Bitcoin Plunges 13% in a Week as Market Retreats to $60,000 LevelBitcoin plunged 13% over the past seven days as bullish defense lines crumbled in succession, officially kicking off the battle to defend the $60,000 mark.On November 16, following a viol
    Author  TradingKey
    Nov 16, Mon
    Bitcoin plunged 13% over the past seven days as bullish defense lines crumbled in succession, officially kicking off the battle to defend the $60,000 mark.On November 16, following a viol
    placeholder
    Bitcoin lost its 200-day average — but the exit started three sessions before the CPIBitcoin fell 2.5% to about $73,400 on 11 November, an 11-week low, breaking its 200-day moving average near $73,100. The 24-hour liquidation tally reached $632 to $705 million, roughly 82% of it longs. But spot ETF outflows began three sessions earlier and USDT's market cap has shrunk $6.6 billion in 60 days — the leveraged length left before the inflation print did. A double top at 81,890 and 81,080 leaves a measured target of 69,366.
    Author  Suzie
    Nov 11, Wed
    Bitcoin fell 2.5% to about $73,400 on 11 November, an 11-week low, breaking its 200-day moving average near $73,100. The 24-hour liquidation tally reached $632 to $705 million, roughly 82% of it longs. But spot ETF outflows began three sessions earlier and USDT's market cap has shrunk $6.6 billion in 60 days — the leveraged length left before the inflation print did. A double top at 81,890 and 81,080 leaves a measured target of 69,366.
    placeholder
    Bitcoin ETFs sold $1.28 billion in a week — and BTC is still above 75,000US spot Bitcoin ETFs logged $1.28 billion of net outflows in the week to Nov 6, the largest since late June, with BlackRock's IBIT accounting for $1.21 billion. Yet BTC only fell from $80,405 to $74,940, a 6.8% move. The gap between the fund flow and the price is the story: leveraged longs were flushed, but spot holders did not follow the ETFs out — and $75,000 is the line that decides whether that reading holds.
    Author  Suzie
    Nov 09, Mon
    US spot Bitcoin ETFs logged $1.28 billion of net outflows in the week to Nov 6, the largest since late June, with BlackRock's IBIT accounting for $1.21 billion. Yet BTC only fell from $80,405 to $74,940, a 6.8% move. The gap between the fund flow and the price is the story: leveraged longs were flushed, but spot holders did not follow the ETFs out — and $75,000 is the line that decides whether that reading holds.
    placeholder
    Binance replaced 95% of a $6.3bn hole — Bitcoin is trading the plumbing, not the coinBinance resumed withdrawals on November 1 after a record $6.3bn theft. In the first 9.5 hours, users withdrew $4.64bn and deposited $1.01bn, a net outflow of $3.64bn, or 2.1% of assets. Bitcoin fell to 76,173 and is now 78,473. The market is pricing the exchange, not the supply.
    Author  Suzie
    Nov 02, Mon
    Binance resumed withdrawals on November 1 after a record $6.3bn theft. In the first 9.5 hours, users withdrew $4.64bn and deposited $1.01bn, a net outflow of $3.64bn, or 2.1% of assets. Bitcoin fell to 76,173 and is now 78,473. The market is pricing the exchange, not the supply.
    placeholder
    Bitcoin is back above $80,000 — but 75% of the bounce was shorts, not buyersBitcoin trades at $80,669, back above the $80,000 line after touching $79,145 on October 24. But 75.4% of the last 24 hours of futures liquidations were shorts, CME open interest fell 36,545 BTC in October, and spot ETFs lost $773.5 million on October 22-23. Price is up; positioning is down. Here is why the bounce is a squeeze, and the four things that would make it real.
    Author  Suzie
    Oct 28, Wed
    Bitcoin trades at $80,669, back above the $80,000 line after touching $79,145 on October 24. But 75.4% of the last 24 hours of futures liquidations were shorts, CME open interest fell 36,545 BTC in October, and spot ETFs lost $773.5 million on October 22-23. Price is up; positioning is down. Here is why the bounce is a squeeze, and the four things that would make it real.
    Live Quotes
    Name / SymbolChart% Change / Price
    BTCUSD
    BTCUSD
    0.00%0.00
    ETHUSD
    ETHUSD
    0.00%0.00
    XRPUSD
    XRPUSD
    0.00%0.00

    Bitcoin Related Articles

    • Bitcoin Leverage And Margin Trading in 2026: The Ultimate Beginner's Guide
    • Gold vs Bitcoin 2026: Which Is the Better Investment?Best Hedge Asset Comparison
    • Best Strategies When BTC Price Drops: From Hedging to Accumulating
    • How to Day Trade Crypto? Simplest Day Trading Strategy Ever
    • Bitcoin Price Prediction 2026-2030: Long-Term Outlook Driven by Data & Macro Cycles
    • Bitcoin Mining Beginner Guide: What Is Bitcoin Mining and How to Mine Bitcoin?

    Click to view more