
Fartcoin Price Forecast: Investors sell off as decline in social chatter risks further losses
- Fartcoin extends the losses for the third consecutive day, putting pressure on a crucial support zone.
- Santiment’s data suggests a significant decline in social chatter on Fartcoin as hype around the meme coin wanes.
- The technical outlook suggests a potential drop to $0.71 if the long-standing support floor fractures.
Fartcoin (FARTCOIN) loses steam, softening by 1% at press time on Thursday and hinting at its third consecutive daily red candle. Amid the gradual decline of social chatter around Fartcoin, the token risks a potential drop below a crucial support level.
Fartcoin's social chatter and optimism drop
Santiment’s social volume indicator indicates a low chatter period in Fartcoin. The indicator calculates the total number of social media messages that have the term Fartcoin. Investors may find the low-chatter period to be an entry opportunity before the next interest spike catalyzes a bullish phase.
Adding credence to low chatter, the social dominance of Fartcoin is down to 0.25% out of the combined social volume of the top 100 cryptocurrencies. Further up, the weighted sentiment around Fartcoin’s social activity stands at -0.275, pointing to a bearish bias.
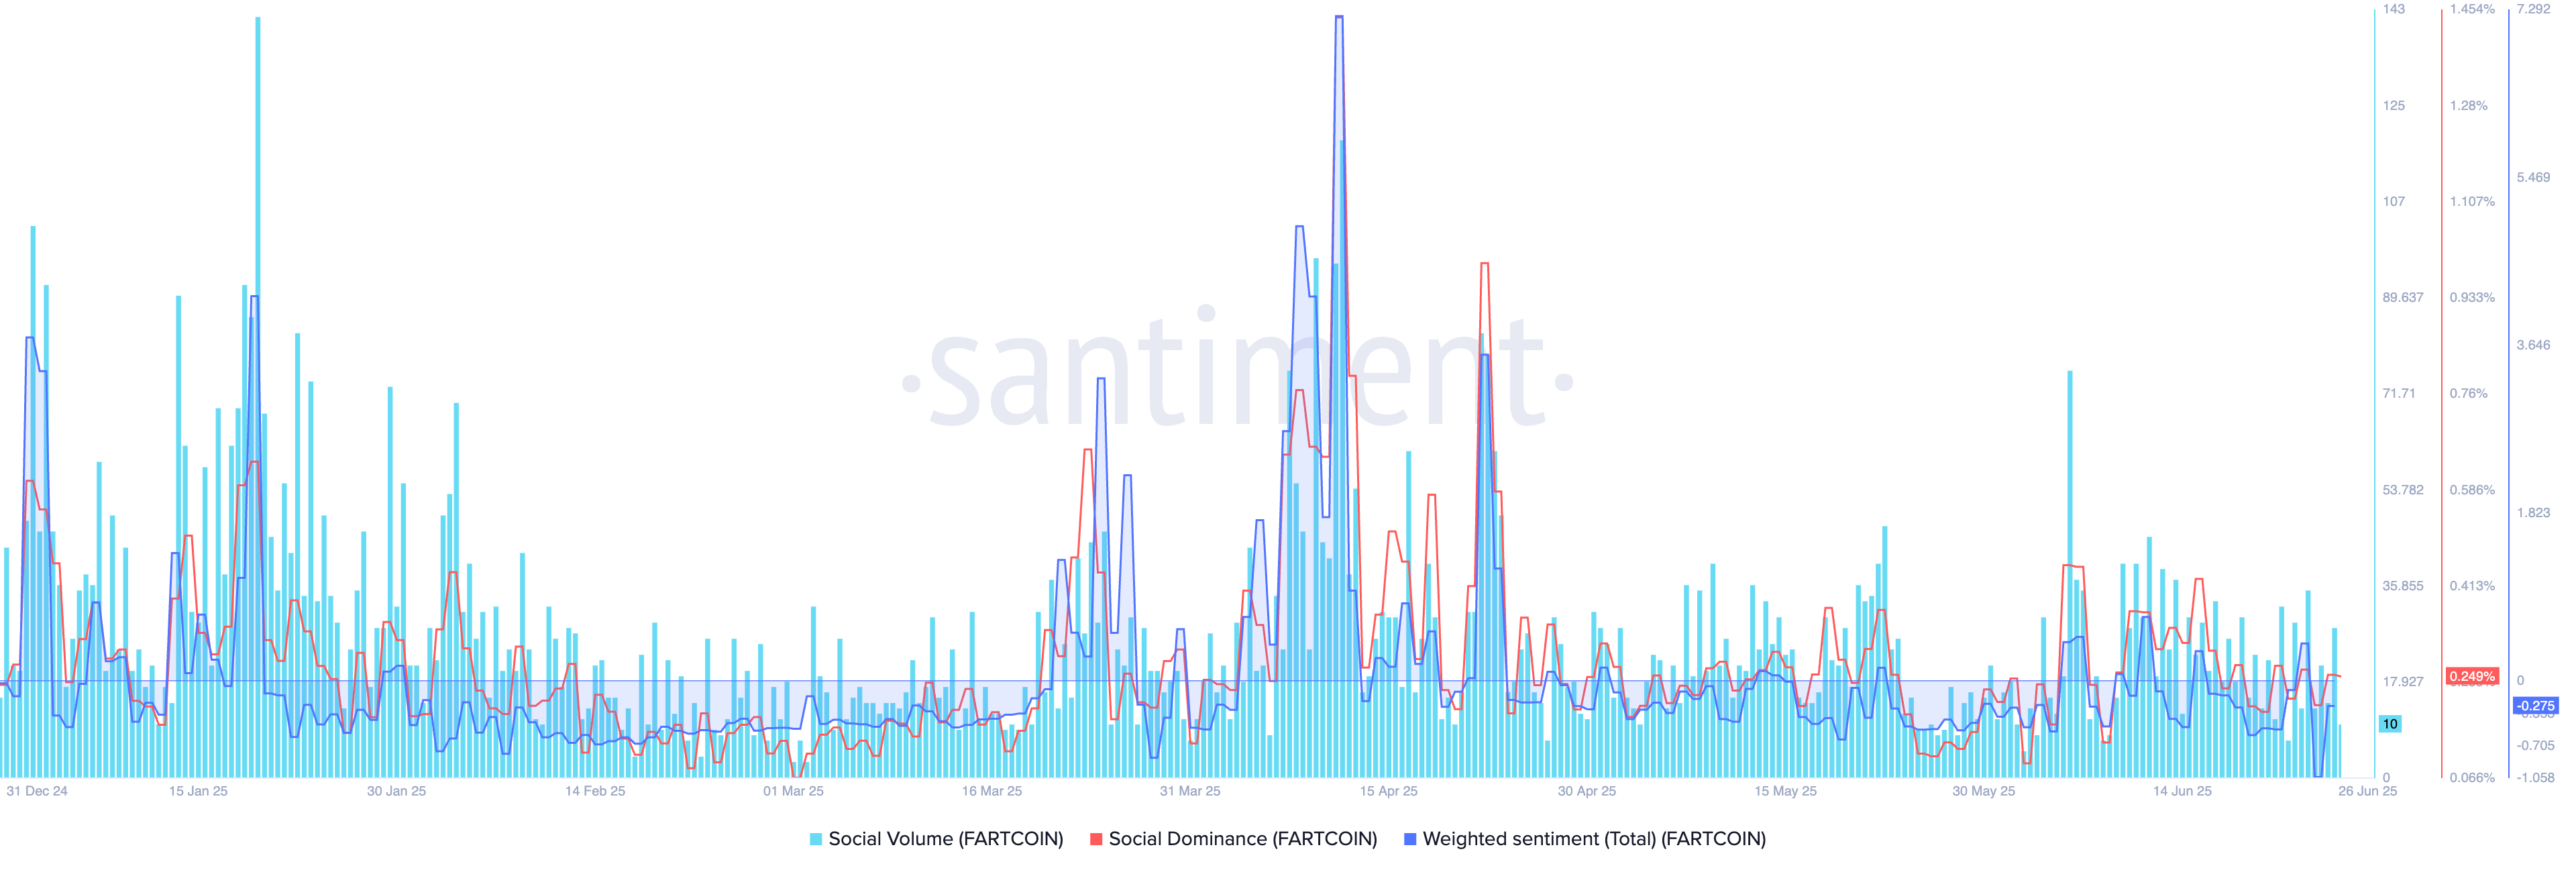
Fartcoin social data. Source: Santiment
CoinGlass’ data shows that derivatives traders are low on optimism, as Fartcoin Open Interest (OI) drops to $562 million at the time of writing, from a peak of $606 million on Wednesday. A slip in OI relates to outflowing capital from derivatives markets as new or additional purchases halt.
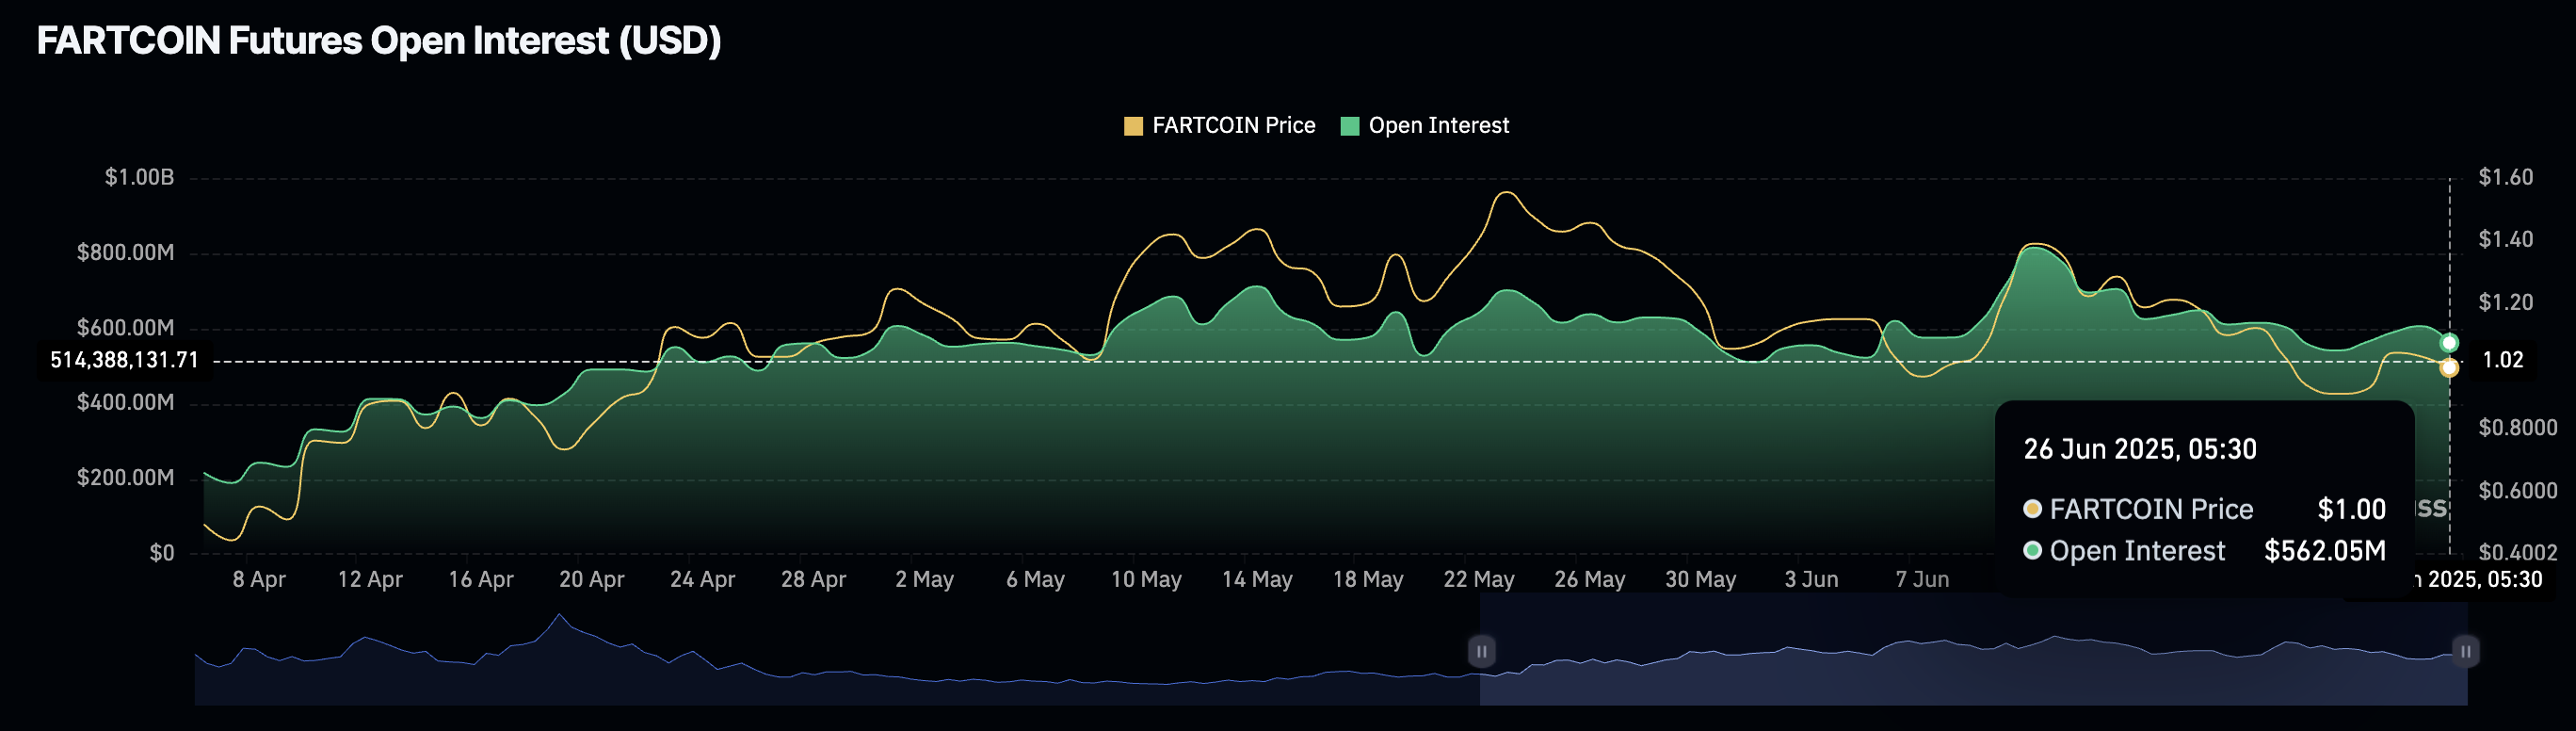
Fartcoin Open Interest. Source: Coinglass
Fartcoin risks a support zone fallout
Fartcoin edges lower by 1% at the time of writing on Thursday as it breaks below the $1.00 psychological level. Inching closer to the $0.92 support zone, marked by a green band on the daily chart below, the meme coin gradually erases the 12% surge from Monday.
A daily close below the $0.92 support floor, which has been in place since May 7, could extend the declining trend to $0.71, marked by the April 18 low.
The Moving Average Convergence/Divergence (MACD) indicator maintains a declining trend with its signal line on the daily chart. However, the diminishing red histogram bars signal a potential trend reversal if the MACD line crosses above the signal line. Investors could consider this crossover as a buying opportunity.
Still, the Relative Strength Index (RSI) reverses from the mid-line to 42, indicating another surge in selling pressure.
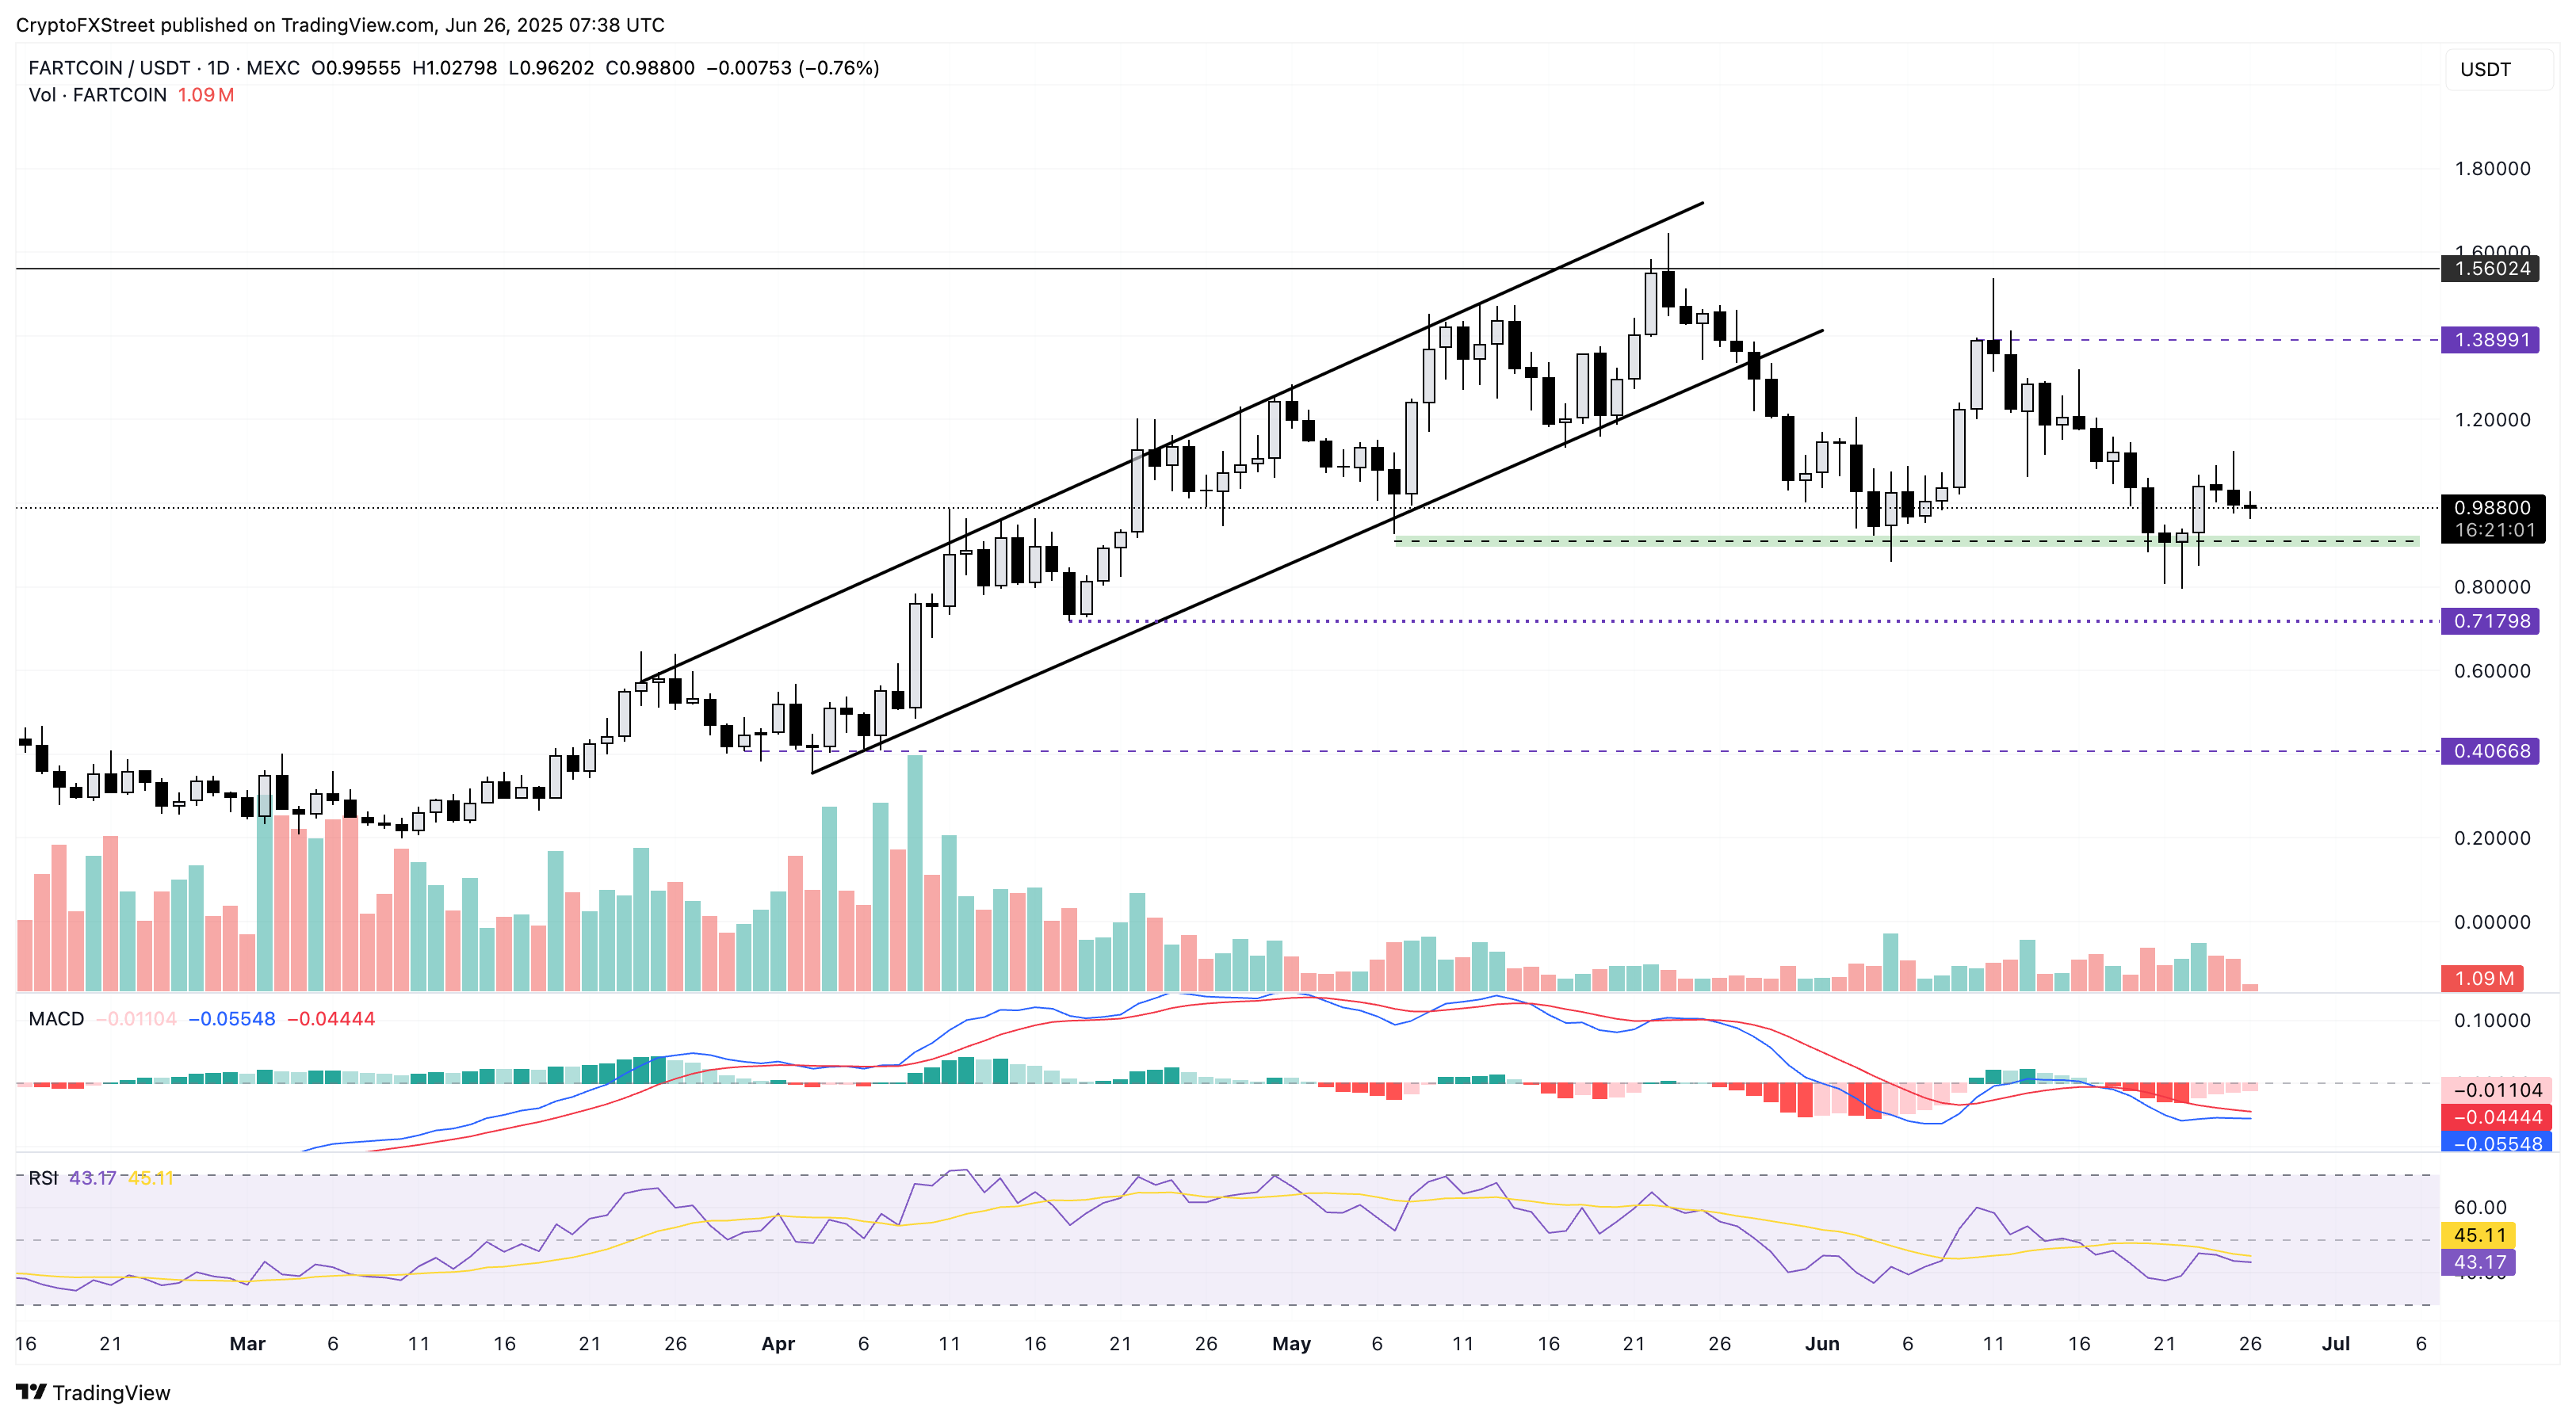
FARTCOIN/USDT daily price chart.
However, a potential bounce back in Fartcoin from the $0.92 support band could propel the meme coin towards $1.38, the highest close in June.
Recommended Articles


