
Gold benefits from a weaker US Dollar as pressure over Fed rate cuts builds
- Gold edges higher as investors shift away from the US Dollar.
- US Dollar strength falters as Fed Powell and President Trump disagree on the timing of interest rate cuts.
- XAU/USD trades between the 50 and 20-day Simple Moving Averages, which provide support and resistance for the precious metal.
Gold is regaining confidence on Thursday as the poor performance of the US Dollar (USD) becomes the dominant driver of price action.
With XAU/USD trading near $3,340 in the European session at the time of writing, the yellow metal continues to display signs of resiliency.
Despite a risk-on tone being adopted by global markets, declines in the Gold price have been limited. This is largely attributed to a decrease in confidence in the Greenback, which has come under scrutiny in recent months.
Investors' focus has now shifted to the timing of when the Fed will begin to cut interest rates, which brings the US economic calendar back into the spotlight.
At 12:30 GMT, the final Gross Domestic Product (GDP) number for the first quarter, weekly Initial Jobless Claims numbers and Durable Goods Orders for May will be released. Pending Home Sales for the month of May are scheduled to be published at 14:00 GMT, which will be followed by additional comments from several Fed speakers.
Additionally, with US President Donald Trump resuming his criticism of Fed Chair Jerome Powell on Wednesday, further comments will be closely monitored.
Daily digest market movers: Gold gains favor as the battle between President Trump and Fed Chair Powell persists
- Fed Chair Powell concluded on Wednesday the two-day semiannual testimony to Congress, during which he was questioned on the Monetary Policy Report. Despite global central banks lowering interest rates amid slowing inflation, the Fed has kept rates unchanged at the 4.25%-4.50% range throughout this year. However, with inflation edging closer to the Fed’s 2% objective target, the timing of the next rate cut has become a contentious issue.
- Recent economic data, including Tuesday’s US Conference Board Consumer Confidence and Wednesday’s US New Home Sales figures, suggest that the US economy is beginning to take strain. However, a major concern for Powell has been the risks that tariffs may pose to inflation, which he believes will only become apparent at a later stage.
- The CME FedWatch Tool reflects expectations for the Fed to adjust rates at upcoming meetings. A rate cut has been and continues to be priced in for September, with a 68% probability of a 25-basis-point (bps) cut and a 21.3% probability of a larger 50 bps cut. So far, this has restricted Gold’s ability to reclaim the record high of $3,500 tested in April
- Meanwhile, US President Trump addressed the media at the NATO summit on Wednesday, discussing various topics, including the US economy. Trump once again condemned Fed Powell for his reluctance to cut rates. One of his quotes included that “He is going out, fortunately. I think he is terrible.”
- In terms of risk sentiment, geopolitical risk has abated for now, with the Israel-Iran ceasefire holding for a third consecutive day. While the situation remains fragile, the lack of new escalations has drawn safe-haven flows away from Gold, placing more emphasis on macroeconomic and policy factors for direction.
- Looking ahead, the release of the monthly US Personal Consumption Expenditures (PCE) data on Friday, the Fed’s preferred inflation gauge, will be critical. A soft print could revive expectations for a near-term rate cut and offer a fresh tailwind for Gold.
Gold technical analysis: XAU/USD lingers between key moving averages
Gold is trading in a tight range on the daily chart, consolidating between key moving averages.
Price action is holding just above the 50-day Simple Moving Average (SMA), currently at $3,325, while the 20-day SMA, at $3,356, now acts as near-term resistance.
Momentum remains neutral, with the Relative Strength Index (RSI) hovering around 50, reflecting a lack of clear directional bias.
Gold (XAU/USD) daily chart
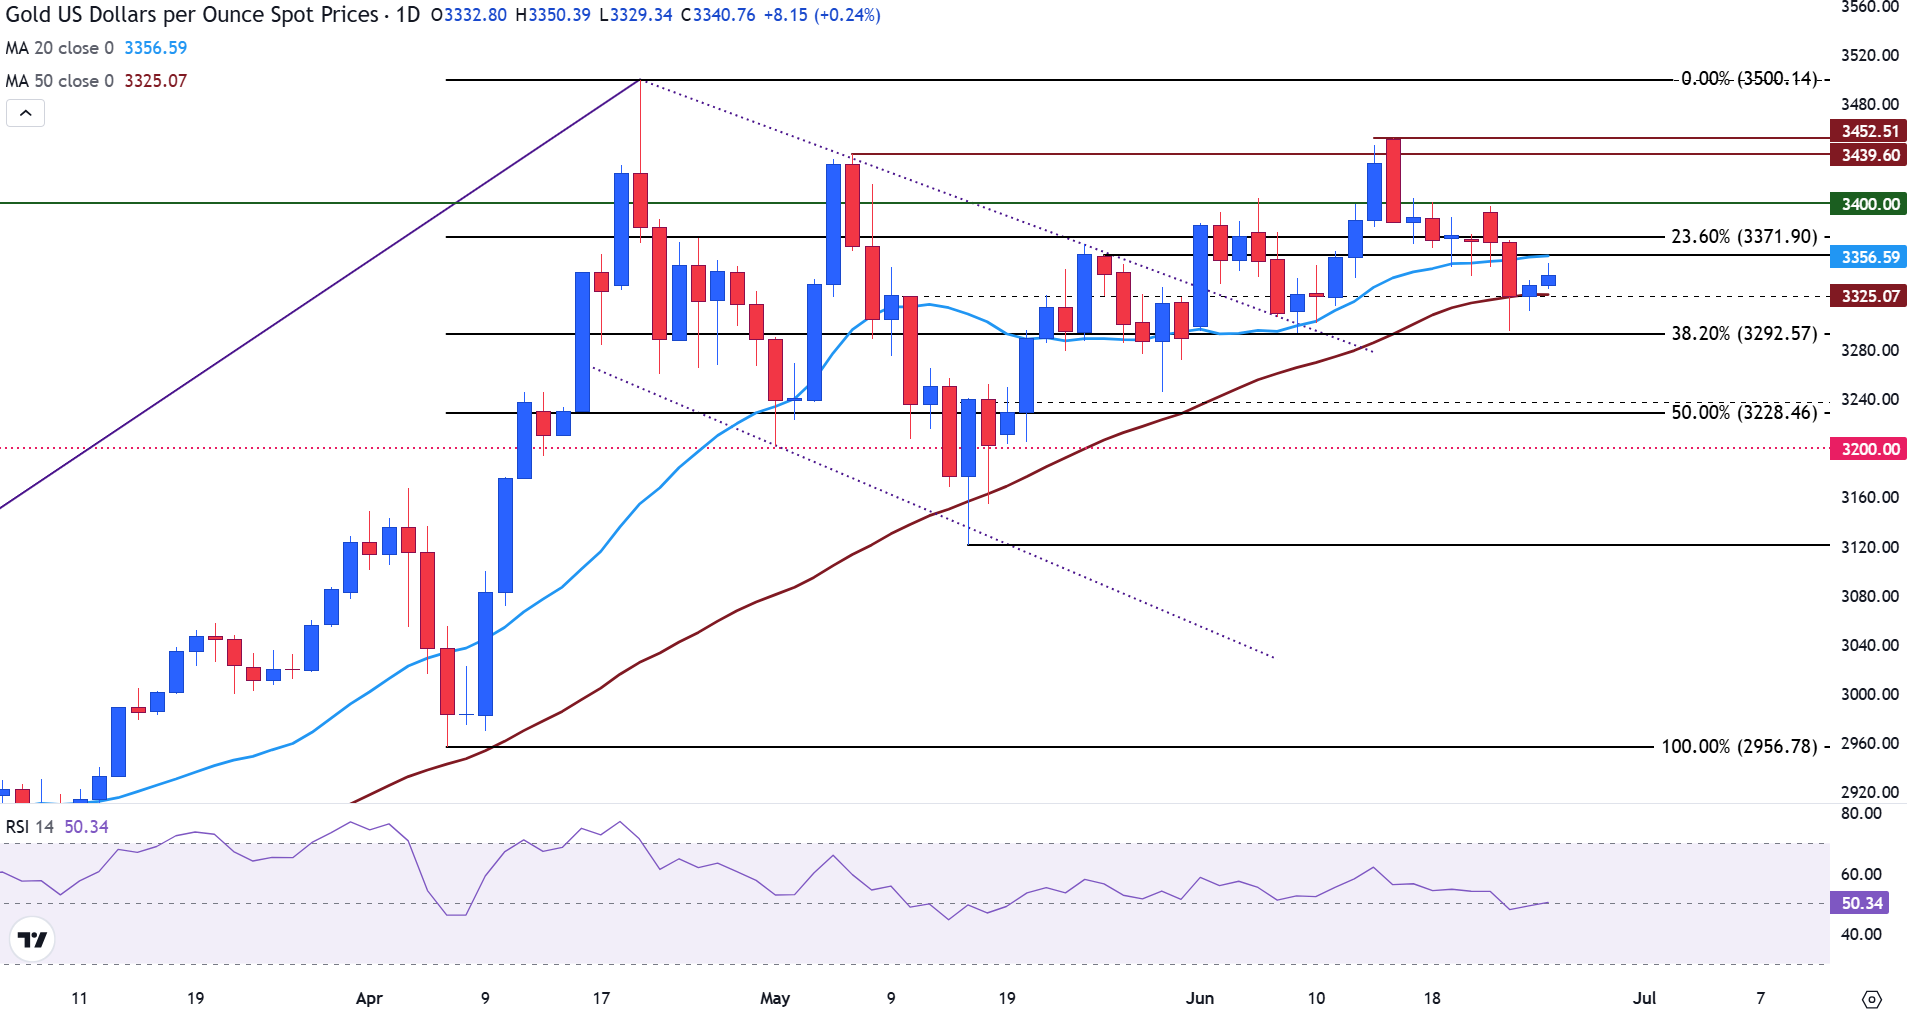
Further up, the next resistance is encountered at the 23.6% Fibonacci retracement of the April rally, near $3,371, while support is found around the 38.2% and 50% Fibonacci levels, at $3,292 and $3,228, respectively.
A sustained move above $3,371 could open the way toward the $3,400–$3,450 zone, while a break below the 50-day SMA may expose deeper support.
US Dollar PRICE Today
The table below shows the percentage change of US Dollar (USD) against listed major currencies today. US Dollar was the strongest against the New Zealand Dollar.
| USD | EUR | GBP | JPY | CAD | AUD | NZD | CHF | |
|---|---|---|---|---|---|---|---|---|
| USD | -0.30% | -0.36% | -0.53% | -0.27% | -0.34% | -0.22% | -0.36% | |
| EUR | 0.30% | 0.00% | -0.29% | 0.06% | 0.00% | 0.09% | -0.03% | |
| GBP | 0.36% | -0.01% | -0.26% | 0.06% | 0.00% | 0.12% | -0.03% | |
| JPY | 0.53% | 0.29% | 0.26% | 0.29% | 0.24% | 0.32% | 0.21% | |
| CAD | 0.27% | -0.06% | -0.06% | -0.29% | -0.05% | -0.04% | -0.09% | |
| AUD | 0.34% | -0.01% | -0.01% | -0.24% | 0.05% | 0.01% | -0.04% | |
| NZD | 0.22% | -0.09% | -0.12% | -0.32% | 0.04% | -0.01% | -0.05% | |
| CHF | 0.36% | 0.03% | 0.03% | -0.21% | 0.09% | 0.04% | 0.05% |
The heat map shows percentage changes of major currencies against each other. The base currency is picked from the left column, while the quote currency is picked from the top row. For example, if you pick the US Dollar from the left column and move along the horizontal line to the Japanese Yen, the percentage change displayed in the box will represent USD (base)/JPY (quote).
Recommended Articles


