


Raydium soars 18% as Upbit lists RAY/KRW and RAY/USDT trading pairs
- Raydium price is rallying by more than 18% on Thursday after finding support around its $2 psychological level.
- South Korea’s largest cryptocurrency exchange, Upbit, lists RAY trading pairs on Thurday.
- CoinGlass Open Interest data for RAY reaches $32.48 million, the highest level since mid-May.
Raydium (RAY) price rallies more than 18% on Thursday after rebounding from its key support the previous day. The main reason for RAY’s rally is that Upbit, South Korea’s largest cryptocurrency exchange, announced the listing of RAY trading pairs. Derivatives data also support the bullish thesis as RAY’s Open Interest (OI) rose and reached levels not seen since mid-May.
Why is Raydium rallying today?
Raydium price soared more than 18% during the early Asian trading session on Thursday. The main reason for this price surge is that South Korea’s largest cryptocurrency exchange, Upbit, has announced that it will list RAY/KRW and RAY/USDT trading pairs. Trading will open at noon (local time) on June 19.
This announcement fueled the rally in RAY, as listing on exchanges increases liquidity, exposure and credibility for the token, bolstering its bullish outlook.

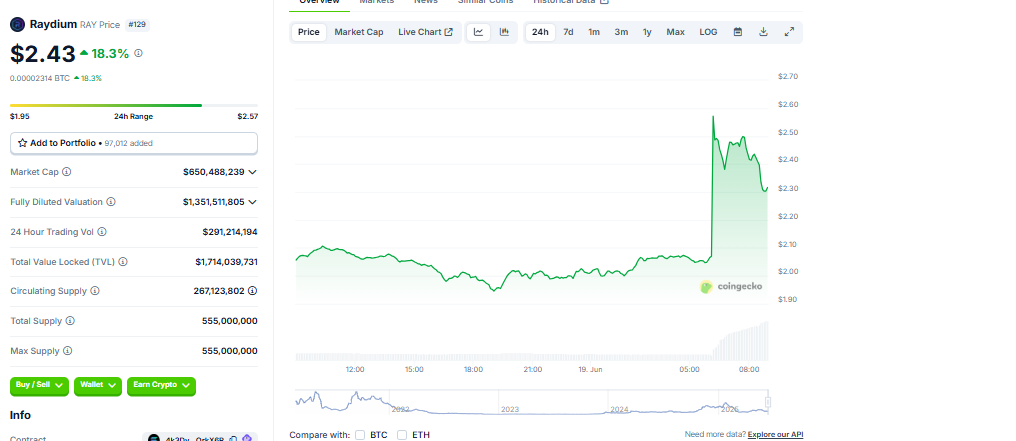
RAY chart. Source: CoinGecko
Looking down on its derivatives data further supports the rally. CoinGlass’ data shows that the futures’ OI in RAY at exchanges rose from $17.49 million on Wednesday to $32.48 million on Thursday, nearly twice the previous level in one day and the highest since mid-May. An increasing OI represents new or additional money entering the market and new buying, which suggests a rally ahead in the Raydium price.
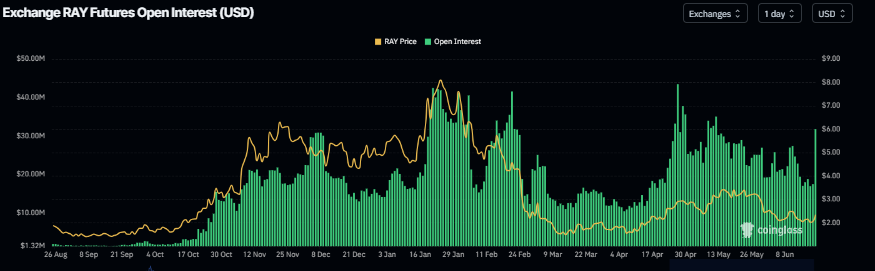
RAY Open Interest chart. Source: Coinglass
Raydium’s psychological level remains strong
Raydium price retested and found support around its key psychological level of $2 on Wednesday. At the time of writing on Thursday, it traded higher by 15.65%, around $2.38.
If RAY continues its upward trend and closes above the 50-day Exponential Moving Average (EMA) at $2.52 on a daily basis, it could extend the rally toward its next daily resistance at $3.05.
The Relative Strength Index (RSI) on the daily chart read 49 points upward, toward its neutral level of 50, indicating a fading of bearish momentum. For the bullish momentum to be sustained, the RSI must move above its neutral level. The Moving Average Convergence Divergence (MACD) is also flipping a bullish crossover on the daily chart. If it flips to a bullish crossover, it would give a buying signal and indicate an upward trend.
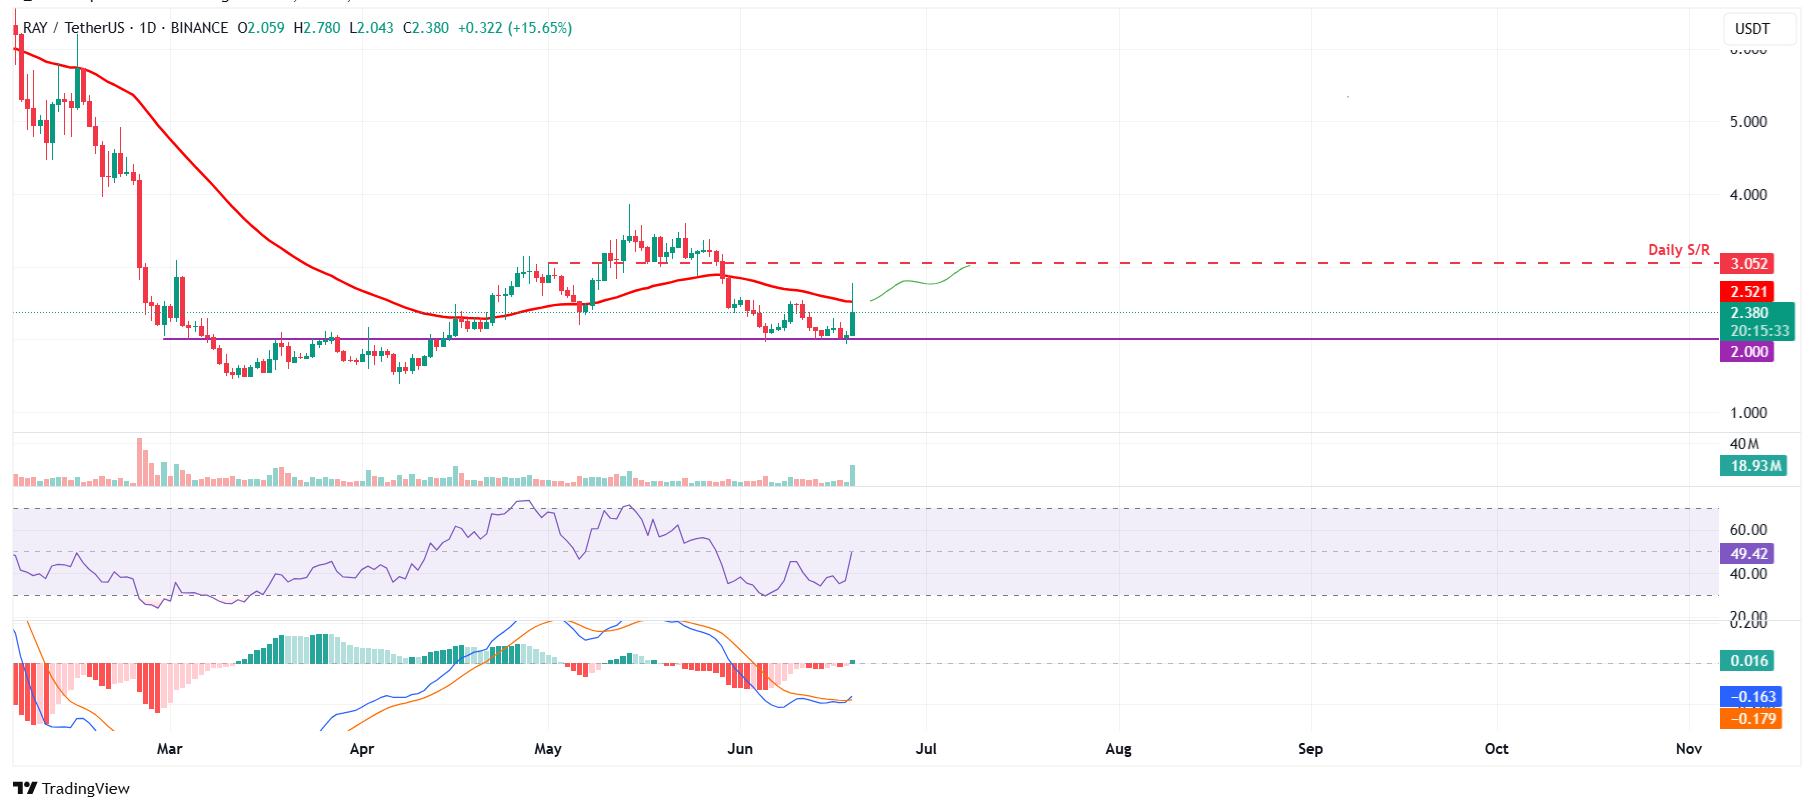
RAY/USDT daily chart
However, if RAY faces a correction, it could extend the decline to retest its key psychological level at $2.
Recommended Articles


