


TRON TVL sees 3.4 billion TRX surge amid Chainlink price oracle integration
- Tron price limits losses on Thursday, outperforming layer-1 rivals including SOL, XRP and ETH.
- DeFiLlama data show Tron's TVL received over 3.4 billion TRX deposits since the start of the week.
- On Thursday, Tron DAO announced the integration of Chainlink price oracle, highlighting upgrades in scalability and security.
TRON price holds steady above $0.27 on Thursday, boosted by TVL's increase of 3.4 billion TRX this week. Will Tron’s latest Chainlink oracle integration announcement finally propel the TRX price above the $0.30 resistance?
TRON outperforms major L1 rivals as TVL grows by 3.4 billion TRX in five days
Tron outpaced other major Layer-1 blockchains on Thursday, limiting losses to just 1.17% while tokens like Ethereum and Solana saw steeper declines.
The resilience in TRX comes amid a surge in network activity and capital inflows into its DeFi ecosystem.
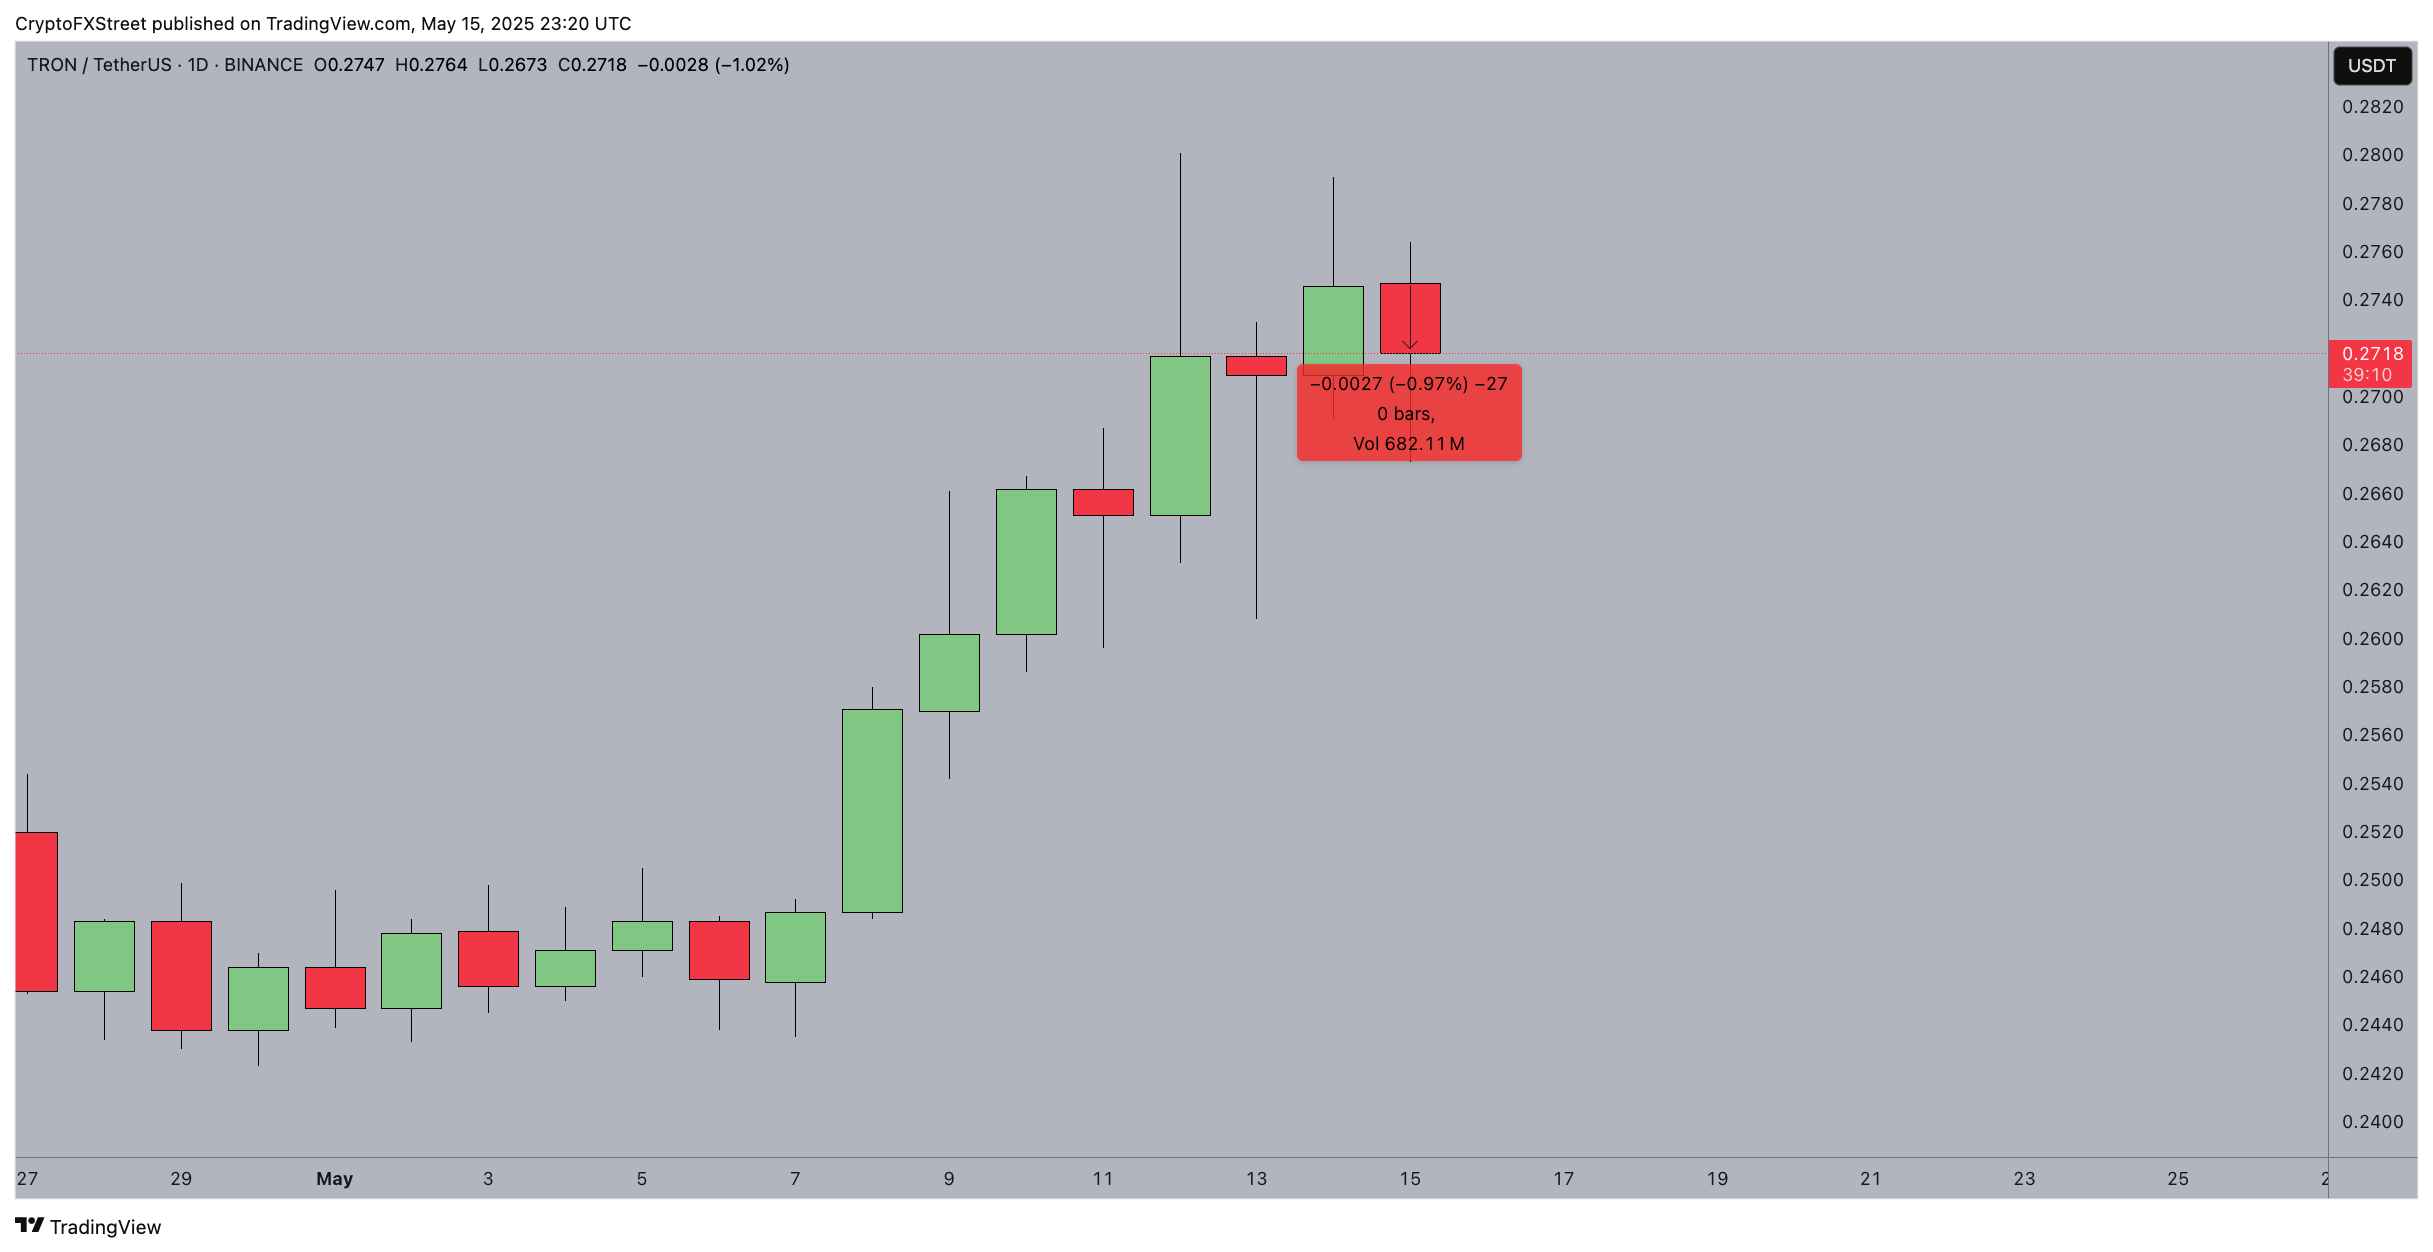
Tron (TRX) Price Action, May 16, 2025 | Source: TradingView/Binance
In terms of internal bullish catalysts, Tron received over 3.4 billion TRX in new deposits this week.
The DeFillama chart below shows how Tron TVL rising from 20.6 billion on May 10 to 24.2 billion TRX at the time of writing on Thursday, marking one of the largest weekly inflows among top chains.
-1747351190322.png)
Tron DeFi Total Value Locked crosses $6.5 billion on May 16, 2025 | DeFillama
In dollar terms, the Tron network’s total value locked (TVL) now exceeds $6.6 billion, ranking third behind only Ethereum and Solana. JustLend and Sun.io are two of the largest Tron-native DeFi protocols attracting the most traction in the ongoing bull cycle.
This sharp rise in TVL coincides with heightened developer activity and network upgrades aimed at scalability and operational efficiency. The positive inflows suggest growing confidence among institutional and retail users in Tron's reliability as a high-throughput settlement layer.
Chainlink oracle feeds could see Tron encroach $3.5 trillion asset tokenization market
In a Thursday post, Tron DAO revealed the official integration of Chainlink’s decentralized price oracles into the Tron network. This move marks a major milestone for the blockchain’s DeFi infrastructure, introducing more secure and reliable data feeds for smart contracts.
By tapping into Chainlink’s globally distributed oracle network, Tron DeFi platforms can now access real-time market data with minimized manipulation risk. Popular use cases include stablecoin pricing, automated lending triggers, and derivatives settlement, which are all critical components for DeFi ecosystems.
Notably, Chainlink’s oracle price feeds have become increasingly critical with the advent of the asset tokenization sectors. By rendering real-time prices feeds, Chainlink enables on-chain trading of tokenized assets.
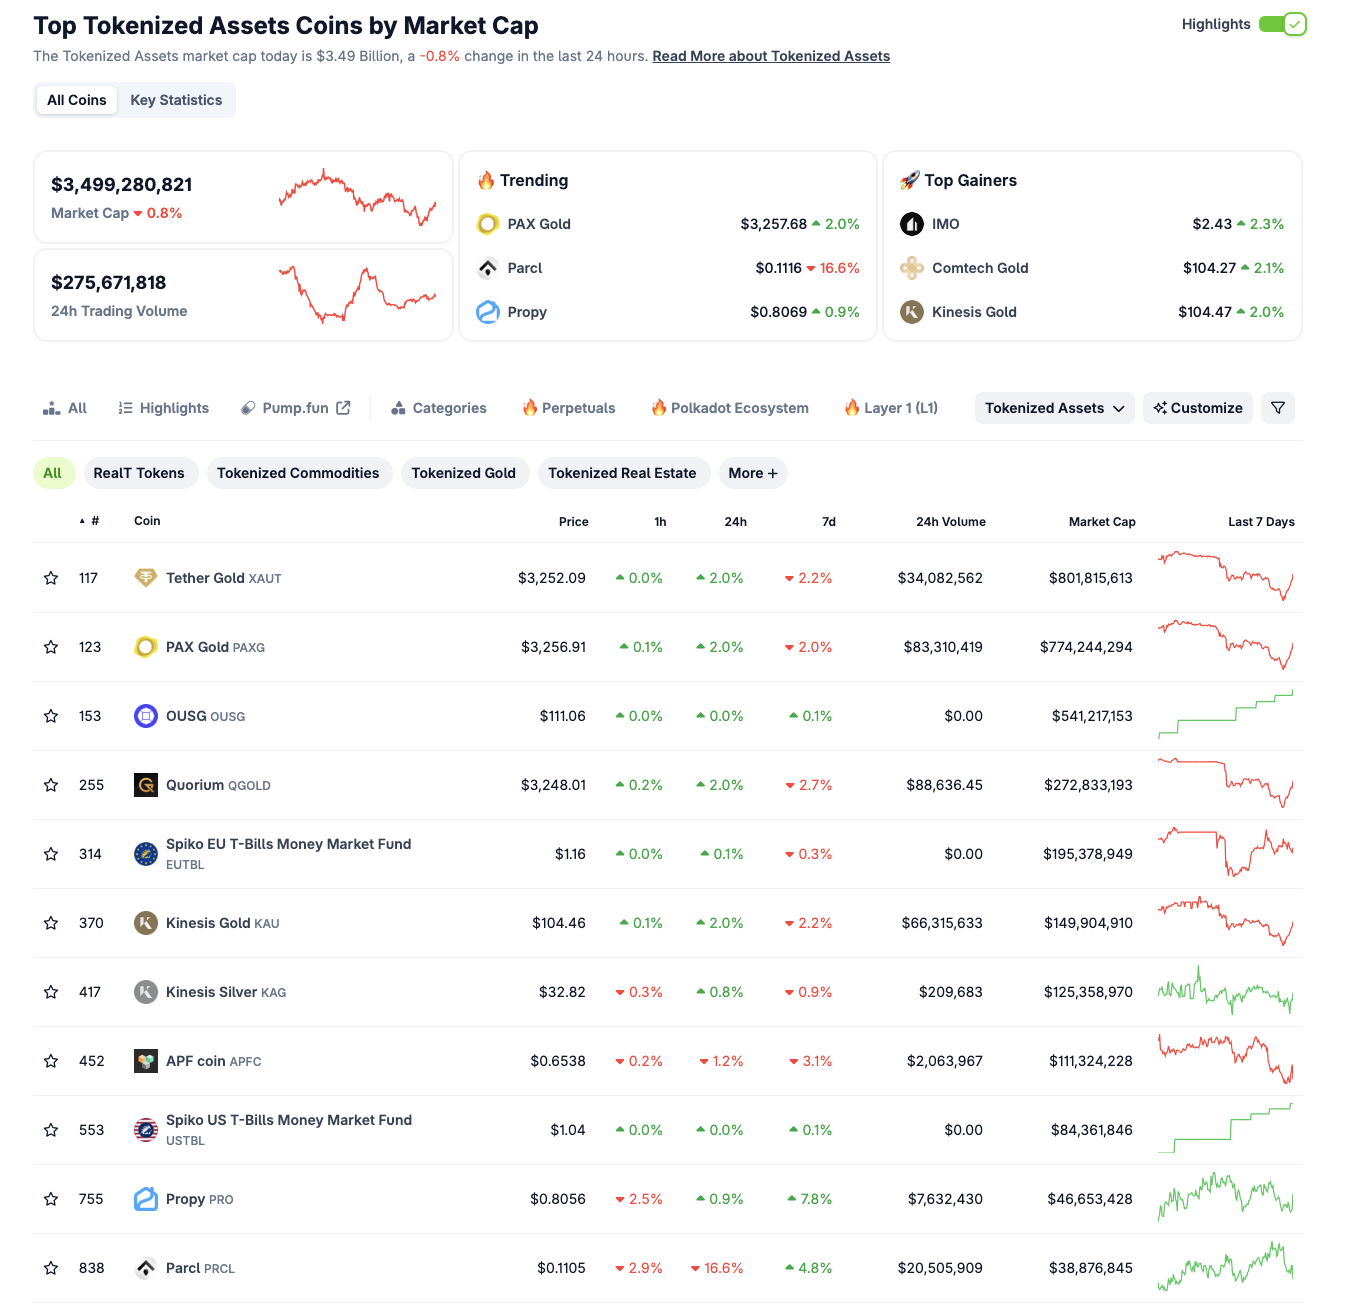
Asset tokenization sector performance as of May 16, 2025 | Source: Coingecko
At the time of publication, Coingecko data shows that Real-World Asset (RWA) and Tokenization sector valuation is around $3.5 billion.
Due to Chainlink’s native tooling, the majority of the largest asset tokenization projects are built on the Ethereum network.
With this Chainlink integration, Tron is now positioned to compete for market share on the asset tokenization front.
Beyond that, Chainlink's integration is expected to reduce latency in data updates for DeFi projects built on the TRON blockchain, Developers will also benefit from more scalable tooling, increasing the likelihood of Tron-based DeFi protocols attracting more TVL in the months ahead.
TRON Price Prediction: TRX eyes retest of $0.30 if bullish momentum persists
TRON put up a resillient showing on Thursday with TRX price consolidating near recent local peaks at $0.27. While the likes of Solana and XRP posted losses exceeding 4%, TRX traders managed to limit losses to just 0.91%.
Key technical indicators on the TRXUSDT daily chart points to a potential retest of the $0.285 resistance level in the near term.
First, Tron price has remained above all key adaptive regression line (ARL) bands, with the upper support zone between $0.256 and $0.262.
More so, the clustering of green candles over the past 10 sessions, accompanied by widening gaps between the ARL bands.
Despite the mild pullback on Thursday, the upper wicks on recent candles show buying strength returning after intraday dips, suggesting demand is still active near $0.27.
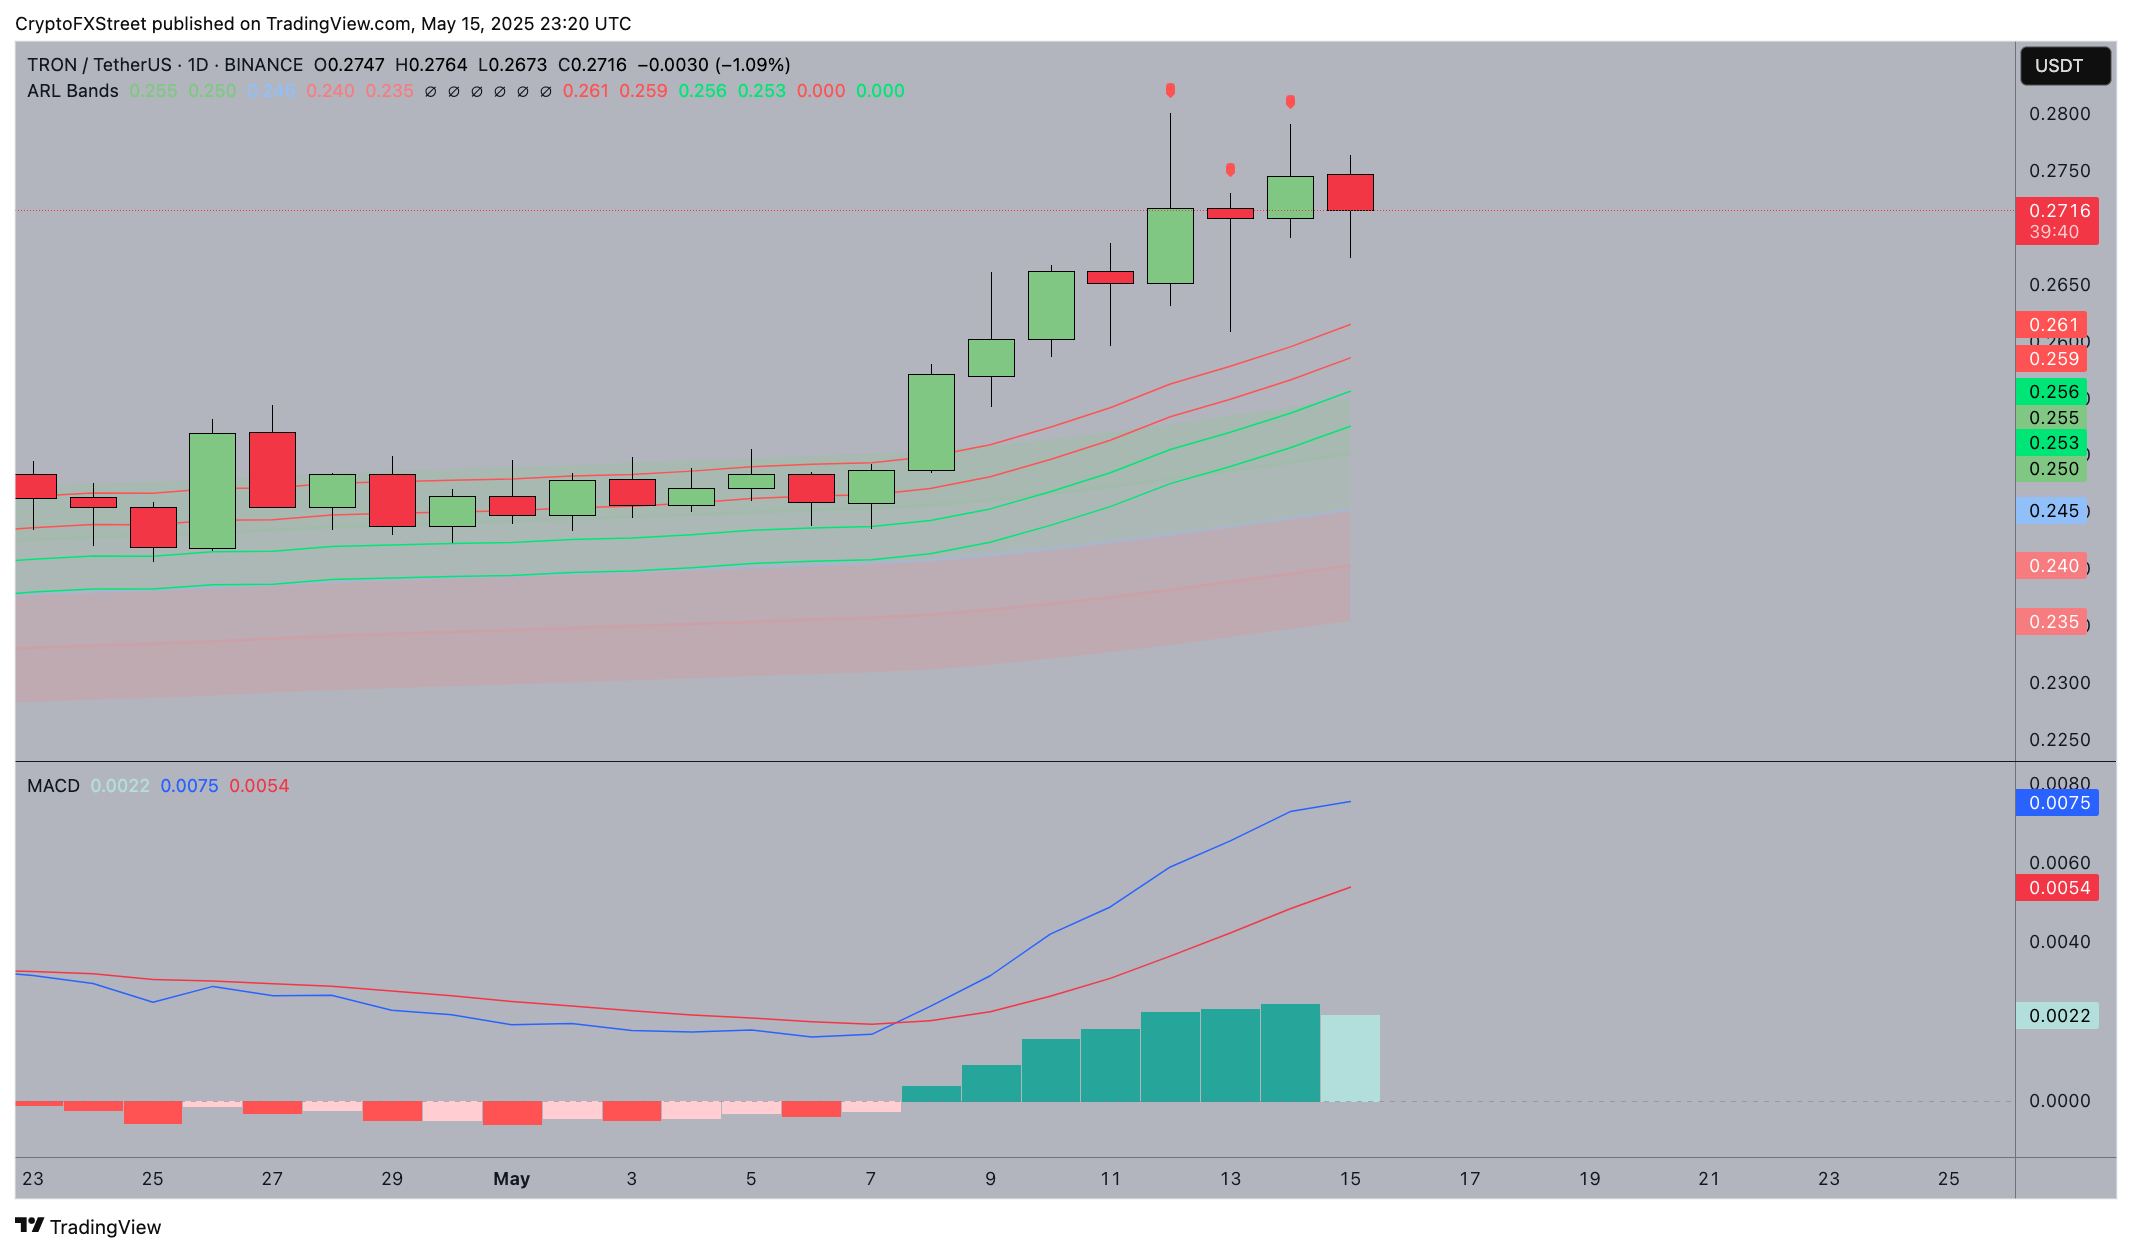
TRON Price Forecast | TRXUSDT
The MACD indicator further validates this view, with a rising histogram and a widening gap between the MACD and signal lines. The blue MACD line at 0.0076 continues to diverge above the red signal line at 0.0054, indicating that bullish momentum is accelerating.
Rising trading volume on recent green candles also supports the case for another leg-up.
In contrast, a daily close below $0.26 would place TRX back into the lower support band, raising the risk of a pullback below the $0.25 psychological support level.
Given these conditions, TRX remains positioned for further upside. A successful reclaim and close above $0.276 could act as a catalyst for a clean breakout toward $0.30, and possibly even $0.35 if sentiment surrounding top altcoins improves.
Momentum traders may continue to view dips into the $0.26 zone as favorable re-entry points, especially if Bitcoin price continues to hold above the $100,000 mark, acting as buffer against cascading losses for top altcoins.
Recommended Articles


