
ETH Traders Eye Breakout as Ethereum Awaits Pectra Upgrade
Ethereum (ETH) is entering a critical week, with technical signals, on-chain data, and a major upgrade all converging. The Pectra Upgrade, set for May 7, aims to improve staking and wallet functionality, but short-term volatility is likely during the rollout.
Meanwhile, ETH’s BBTrend sits at 1.22, showing early bullish momentum, though not yet strong enough to confirm a breakout. At the same time, whale activity remains near 5,463 addresses, and price continues to trade in a tight range between $1,828 and $1,749—setting the stage for a potential breakout or breakdown.
Ethereum Pectra Upgrade Set for May 7: What to Expect
Ethereum’s highly anticipated Pectra Upgrade is set to go live on May 7, introducing 11 new Ethereum Improvement Proposals (EIPs). EIP-7251 stands out for raising the staking cap from 32 ETH to 2048 ETH, aiming to streamline validator operations and boost staking efficiency.
The upgrade also includes wallet improvements focused on user experience, such as easier recovery and gasless transactions, which could drive broader dApp adoption. While this may increase ETH demand long term, exchanges could temporarily halt ETH transfers during deployment, causing short-term volatility.
Though the upgrade promises significant enhancements, it has already faced multiple delays due to extended testing on networks like Hoodi and Sepolia. A smooth rollout may boost confidence and price, but any technical issues could trigger negative market reactions.
ETH Trend Signal at 1.22: Early Uptrend or Just Noise?
Ethereum’s BBTrend indicator is at 1.22, signaling a mild bullish bias. Over the past day, the BBTrend reached a high of 2.23, showing stronger momentum before pulling back slightly.
Although the current reading has cooled, it remains positive, suggesting the uptrend is not yet invalidated. Traders are watching whether BBTrend can rise again to confirm renewed strength or if momentum continues to fade.
The BBTrend (Band-Break Trend) is a volatility-based indicator designed to detect the strength and direction of price trends. Readings above 1.00 typically suggest a bullish trend, while readings below -1.00 indicate a bearish trend.
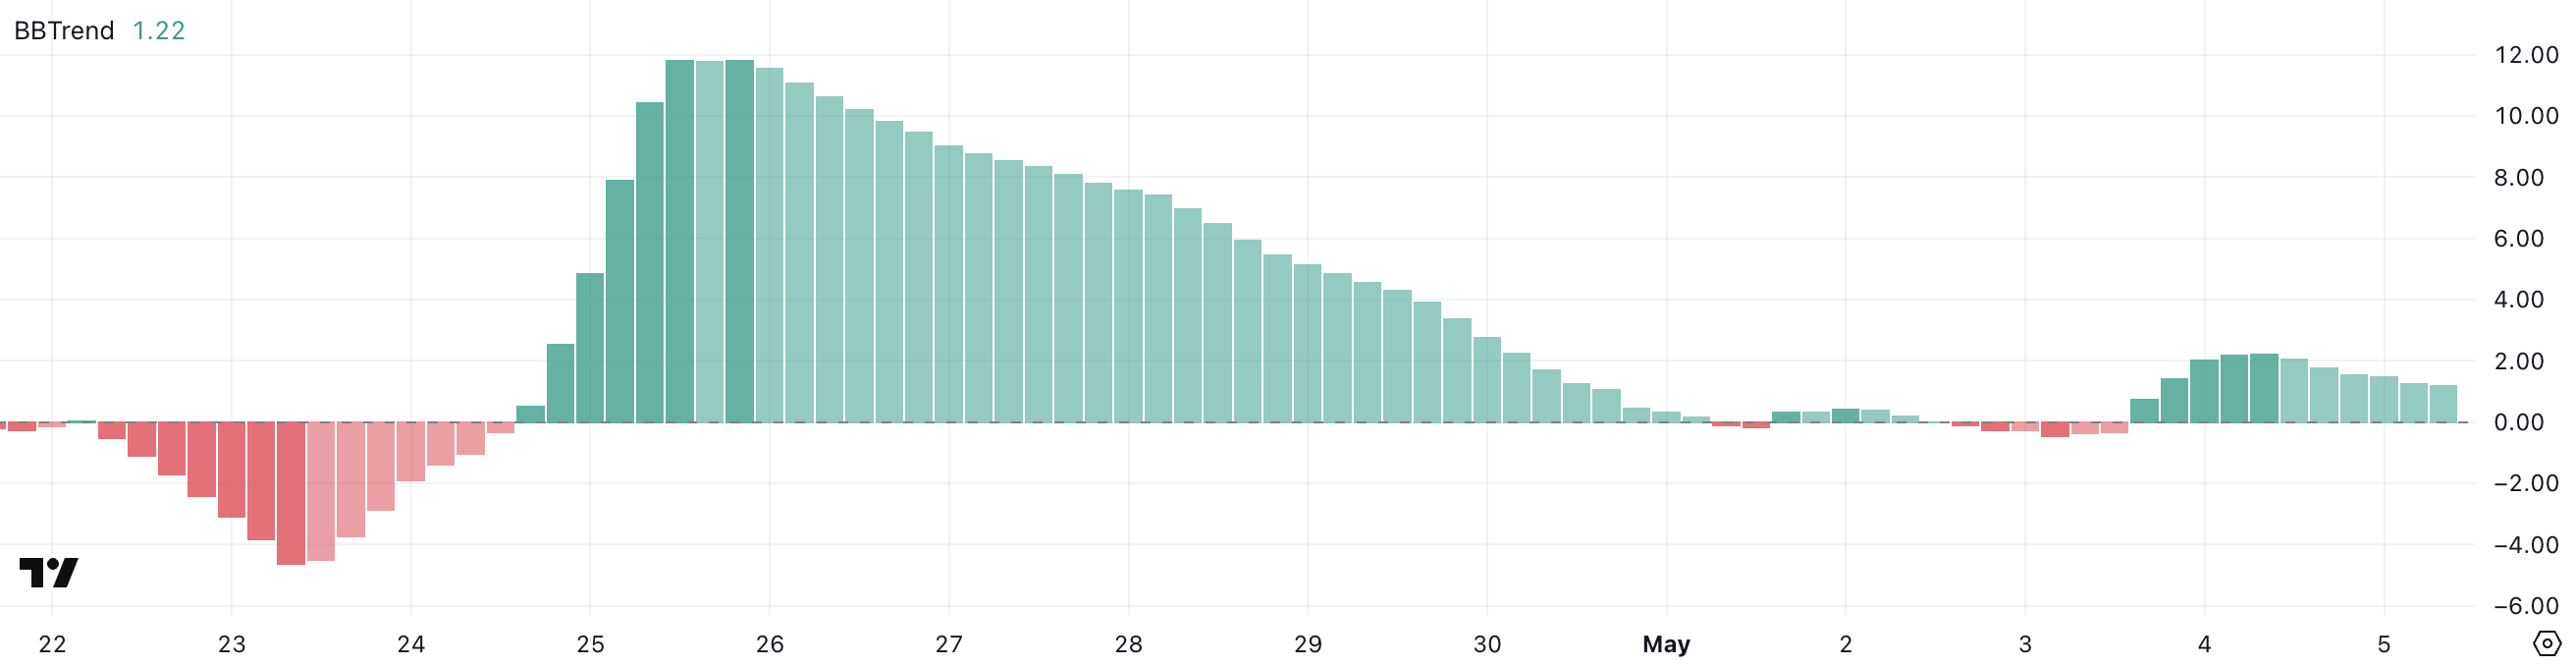 ETH BBTrend. Source: TradingView.
Values between -1.00 and 1.00 are considered neutral or trendless, signaling either sideways movement or weak conviction in either direction. The farther the BBTrend moves from zero, the stronger the trend, making values like 2.23 notable for trend confirmation.
With ETH’s BBTrend at 1.22, the indicator hints at a weak but positive trend—suggesting Ethereum may be entering the early stages of an uptrend.
However, it’s not a strong breakout level, meaning the price could still reverse if selling pressure increases or momentum fades.
A push back above 2.00 would likely confirm sustained bullish momentum, while a drop below 1.00 might indicate a return to consolidation or even a shift to bearish conditions.
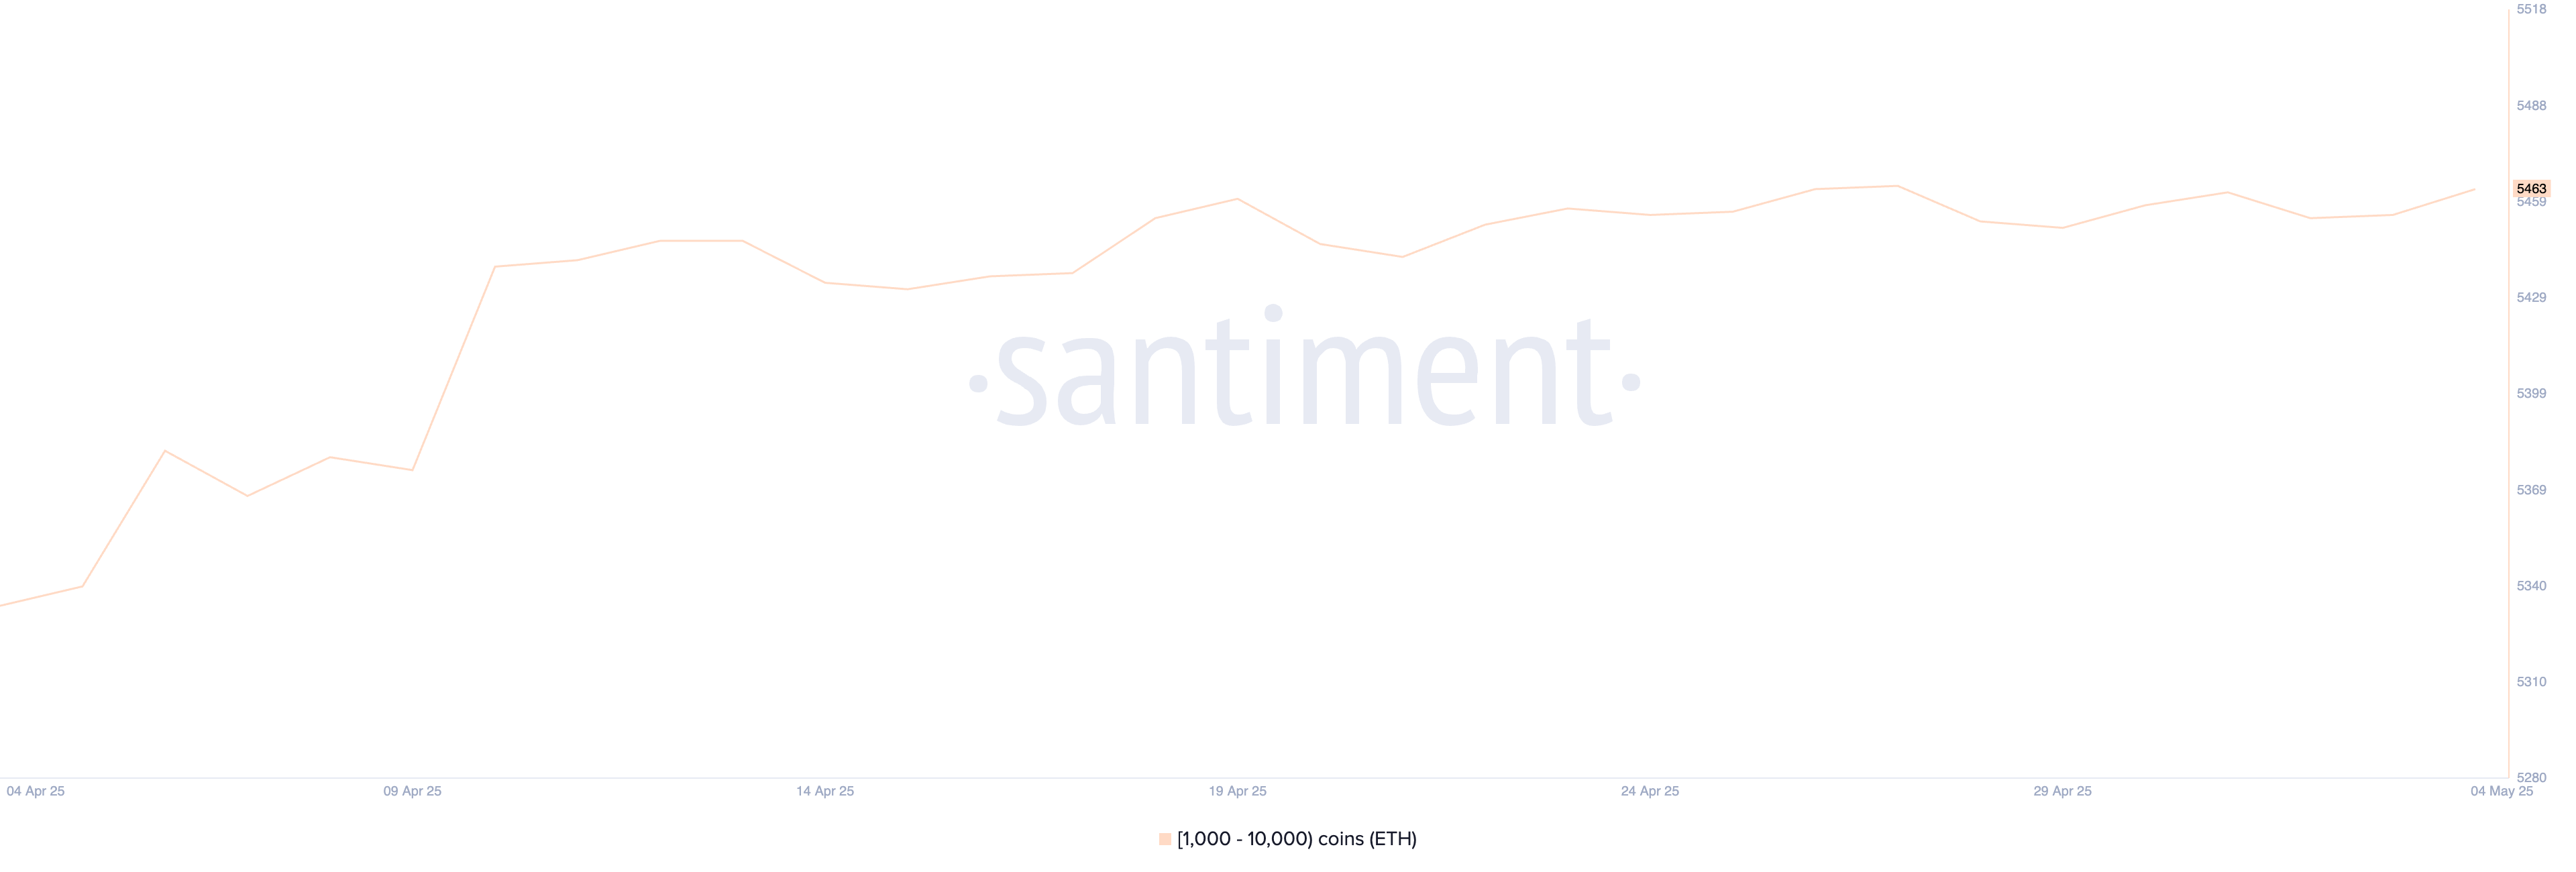 Ethereum Whales. Source: Santiment.
Adding to the broader picture, the number of Ethereum whales—addresses holding between 1,000 and 10,000 ETH—currently stands at 5,463.
This number has fluctuated in recent weeks, struggling to break decisively higher. Whale activity is a critical on-chain signal, as these large holders often influence price movements through accumulation or distribution. A steady or rising whale count typically signals confidence and long-term accumulation, which could support ETH’s price in the coming weeks.
Conversely, a continued stall or drop in whale numbers may reflect hesitation among larger investors, potentially limiting upside momentum.
ETH Stuck in a Range as Traders Await Breakout or Breakdown
Ethereum price has traded between $1,828 resistance and $1,749 support since April 21. The range has held for over two weeks, showing market indecision.
The EMA lines remain bullish, with short-term averages still above long-term ones. However, they’re starting to converge, and a death cross could form soon.
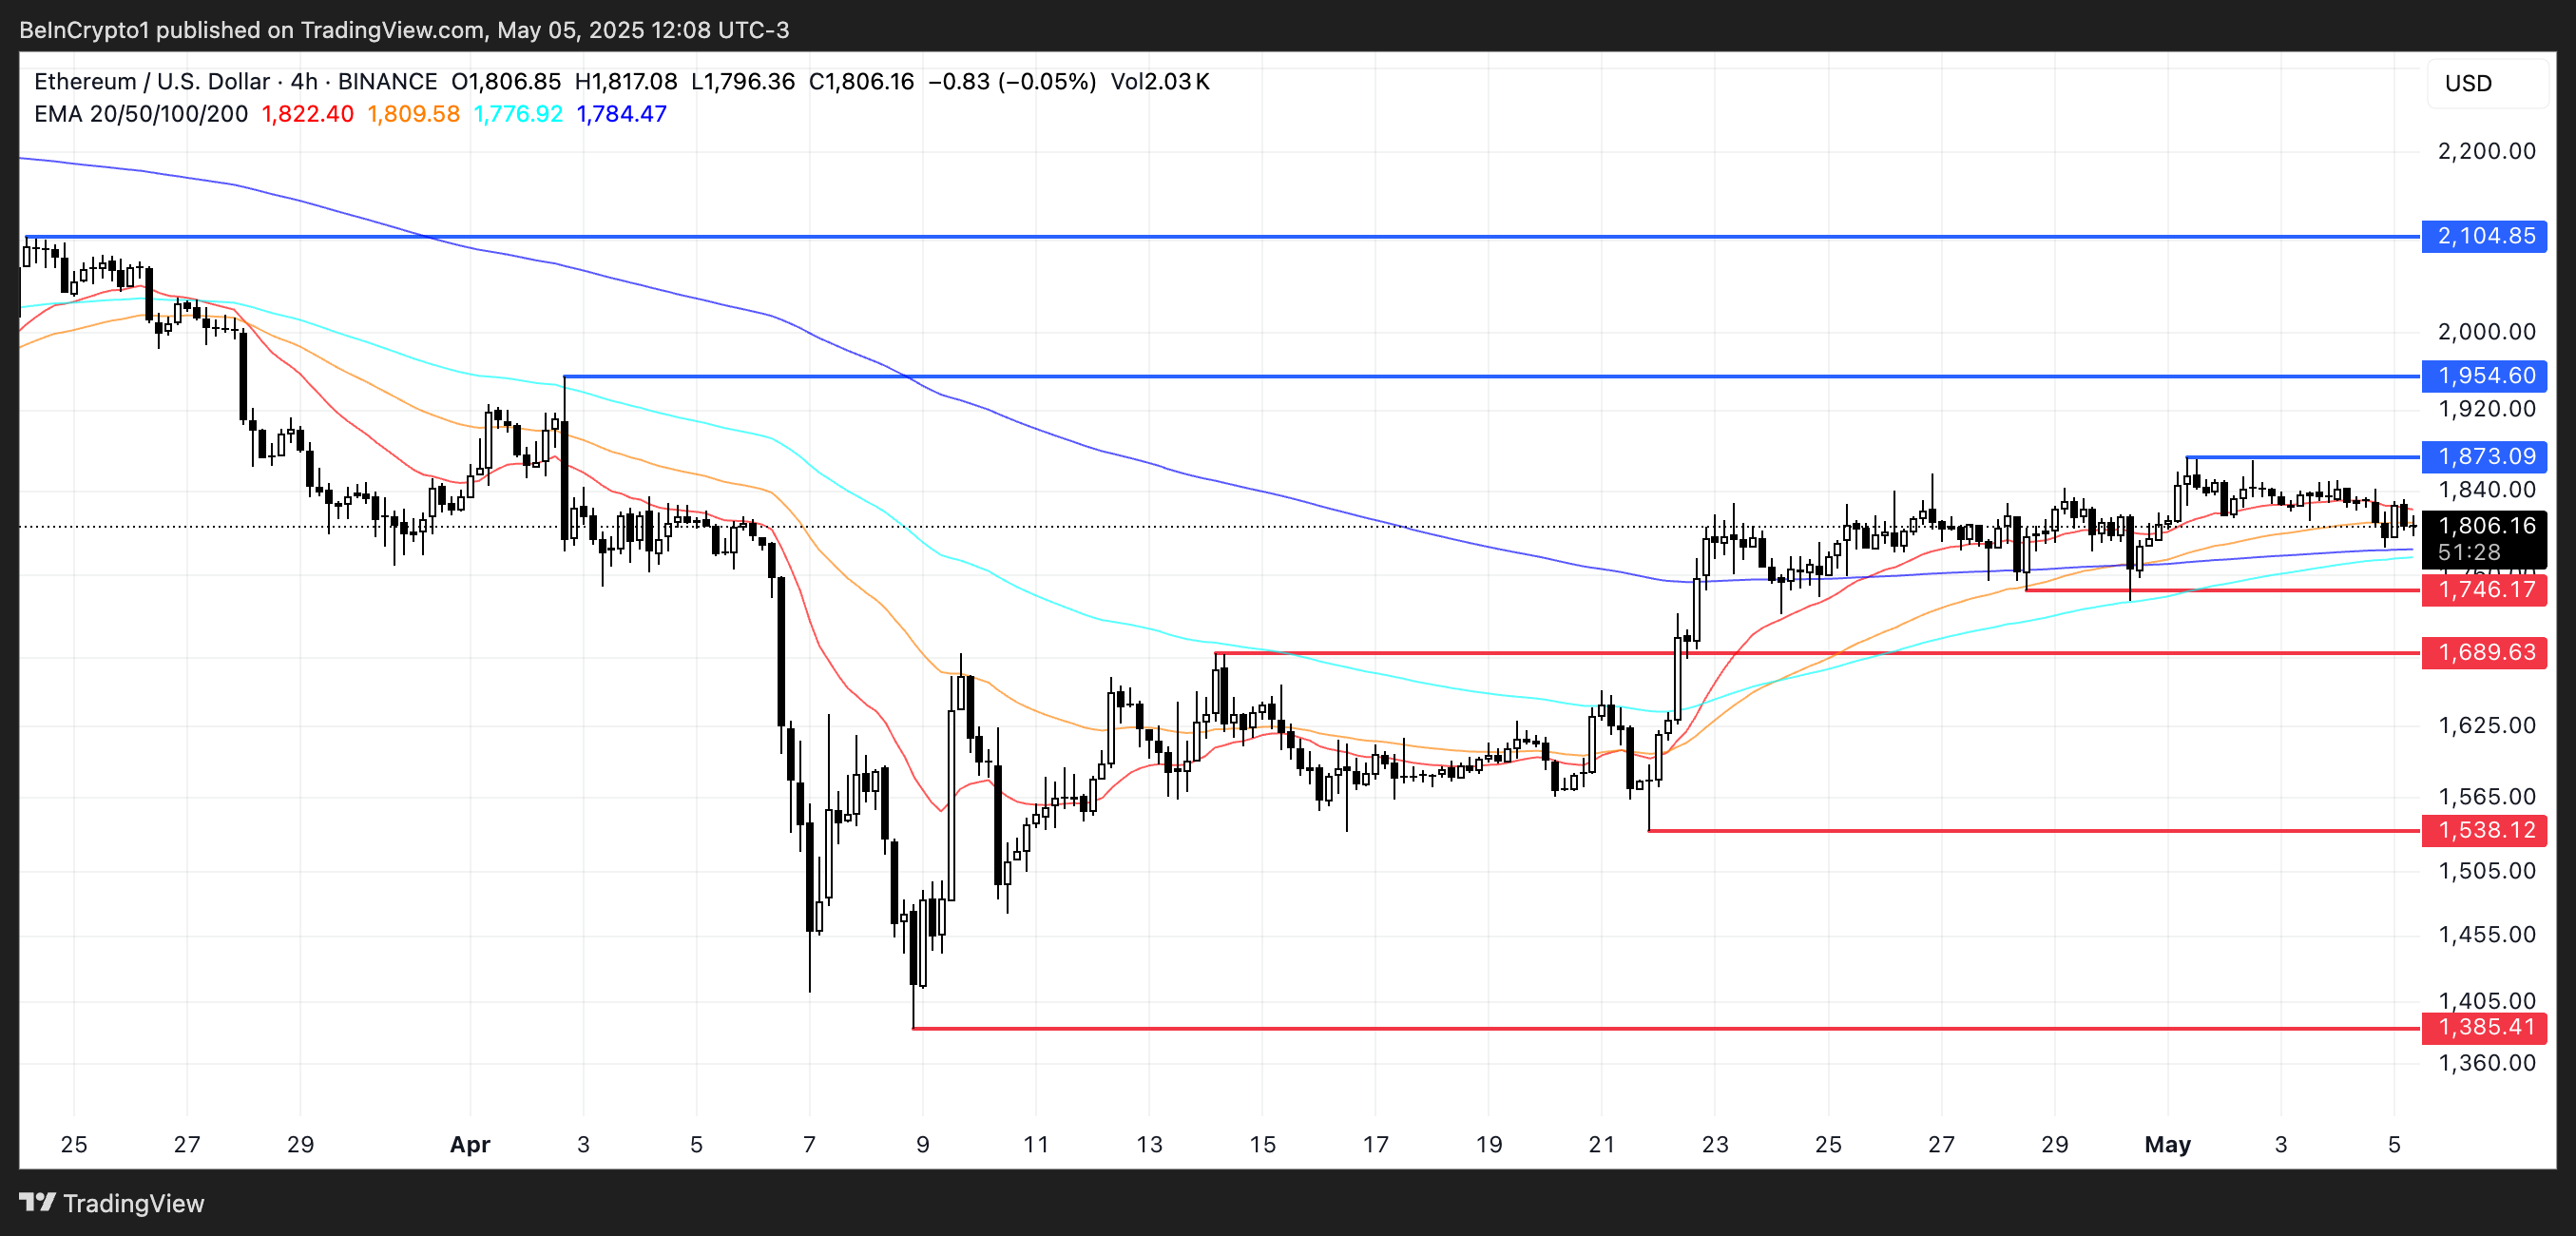 ETH Price Analysis. Source: TradingView.
If the $1,749 support breaks, ETH could fall to $1,689. If the downtrend intensifies, targets like $1,538 and $1,385 become relevant.
On the upside, if ETH breaks $1,873, it could rally to $1,954, and possibly hit $2,104, reclaiming the $2,000 level for the first time since March 27.
Recommended Articles


