

Top 3 Price Prediction: Bitcoin, Ethereum, Ripple – BTC, ETH, and XRP dips as US involvement in Israel-Iran conflict looms

- International Oil Prices Retreat Rapidly; G-7 to Discuss Emergency Oil Reserve Release
- Senate to vote on Trump’s pro-Bitcoin Fed pick as BTC hits four-week high
- Gold slumps below $5,100 as US Dollar gains
- Crypto’s Great Recovery: Is the Post-Conflict Surge a Sustainable Rally or a Sophisticated Bull Trap?
- Gold slumps to near $5,050 on oil-driven inflation fears, stronger US Dollar
- WTI recovers to near $86.50 as Strait of Hormuz remains closed

Bitcoin trades around $104,000 on Wednesday, down 2% from Tuesday, as geopolitical tensions continue to weigh on the market.
Ethereum is nearing its lower consolidation boundary of $2,461; a close below this level would indicate a correction ahead.
XRP faces rejection from its 50-day EMA at $2.24, increasing the likelihood of a short-term correction.
Bitcoin (BTC), Ethereum (ETH) and Ripple (XRP) prices hovered around key levels on Wednesday after falling the previous day. The crypto market turned risk-averse amid growing concerns that the United States could intervene in the escalating conflict between Israel and Iran. These rising geopolitical conflicts could trigger a risk-off sentiment in the market, signaling the potential for further downside across major digital assets.
Bitcoin could dip further if it closes below its 50-day EMA
Bitcoin price declined sharply, falling from the June 10 open of $110,274 to the June 11 close of $105,671, creating a Fair Value Gap (FVG) at approximately $108,064. This bearish FVG marks a key resistance zone, meaning that once Bitcoin collects liquidity, it is likely to continue its correction.
On Monday, BTC retested and faced a slight pullback from this FGV zone, closing the day up by 1.14%. However, it declined by 2.10% the next day and retested its 50-day Exponential Moving Average (EMA) around $103,070. At the time of writing on Wednesday, it hovers at around $105,000.
If BTC continues its correction and closes below the 50-day EMA at $103,070 on a daily basis, it could extend the decline to retest its key psychologically important level at $100,000.
The Relative Strength Index (RSI) momentum indicator on the daily chart has slipped below its neutral level of 50, indicating bearish momentum. The Moving Average Convergence Divergence (MACD) indicator on the daily chart displayed a bearish crossover last week. It also shows a rising red histogram bar below its neutral level, indicating bearish momentum and giving credence to the downward trend.
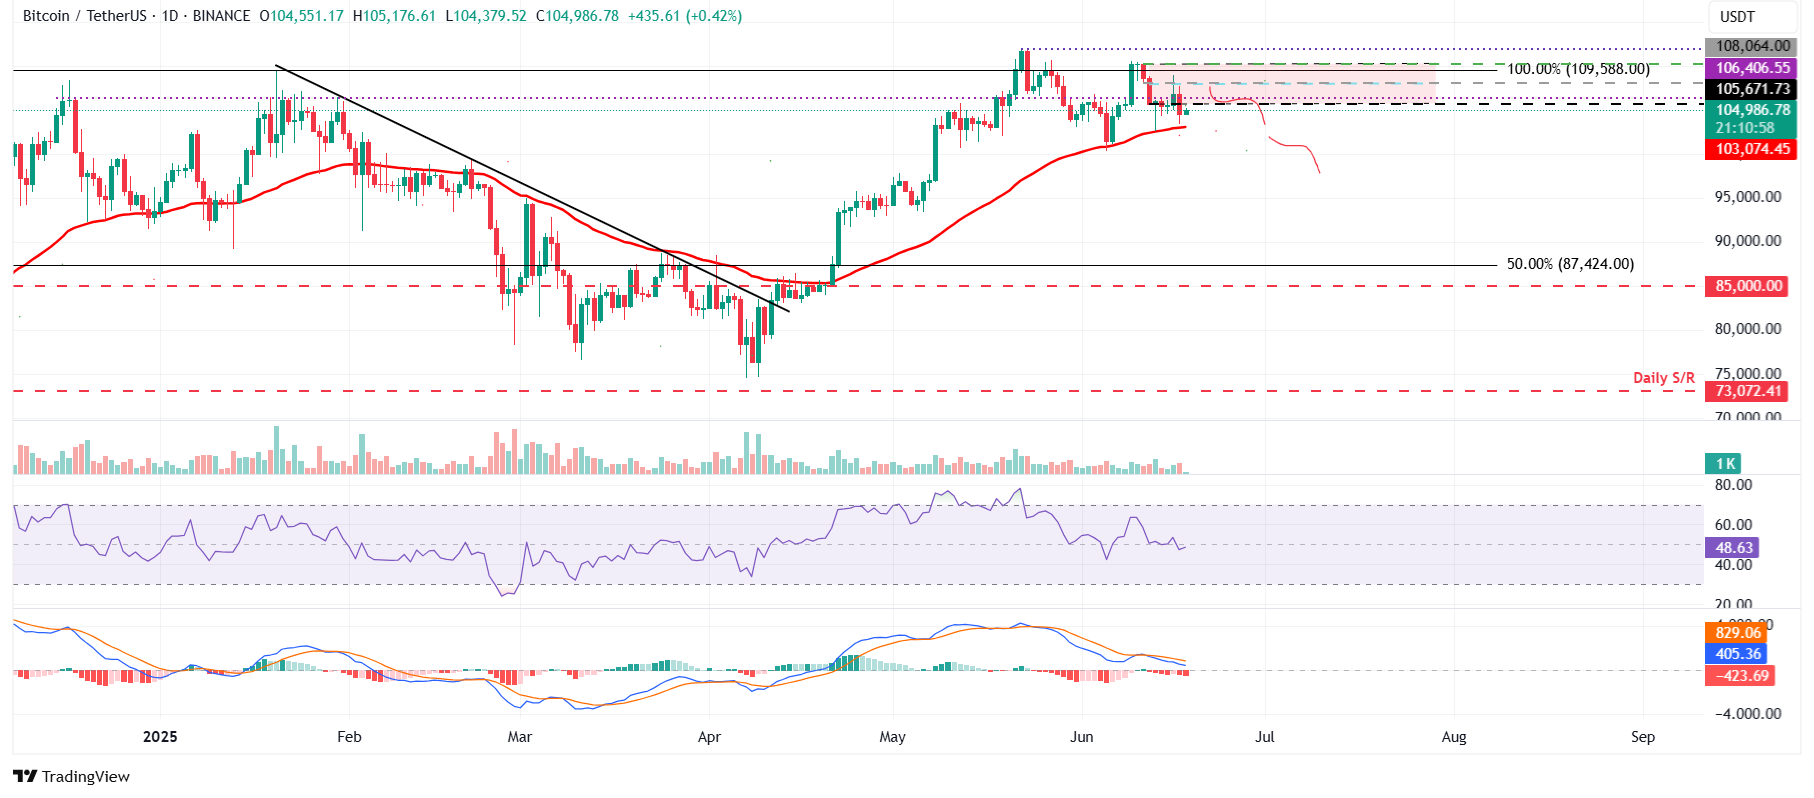
BTC/USDT daily chart
On the contrary, if BTC recovers and closes above its FVG level at $108,064, it could extend the recovery toward retesting its May 22 all-time high of $111,980.
Ethereum could face a downleg if it closes below key support
Ethereum price failed to find support around the upper consolidation level of $2,724 on June 12 and declined by 8.69% until Saturday. However, ETH hovered above its lower consolidation boundary of $2,461 the next day. On Monday, it attempted to retest but was rejected around its upper consolidation level and declined toward its 50-day EMA at $2,434 the next day. At the time of writing on Wednesday, it hovers at around $2,500.
If ETH continues its pullback and closes below its 50-day EMA at $2,434, it could extend the decline to retest its next support level at $2,000.
The RSI on the daily chart has slipped below its neutral level of 50, indicating bearish momentum. The MACD indicator on the daily chart displayed a bearish crossover last week. It also shows a rising red histogram bar below its neutral level, indicating bearish momentum and suggesting a downward trend.
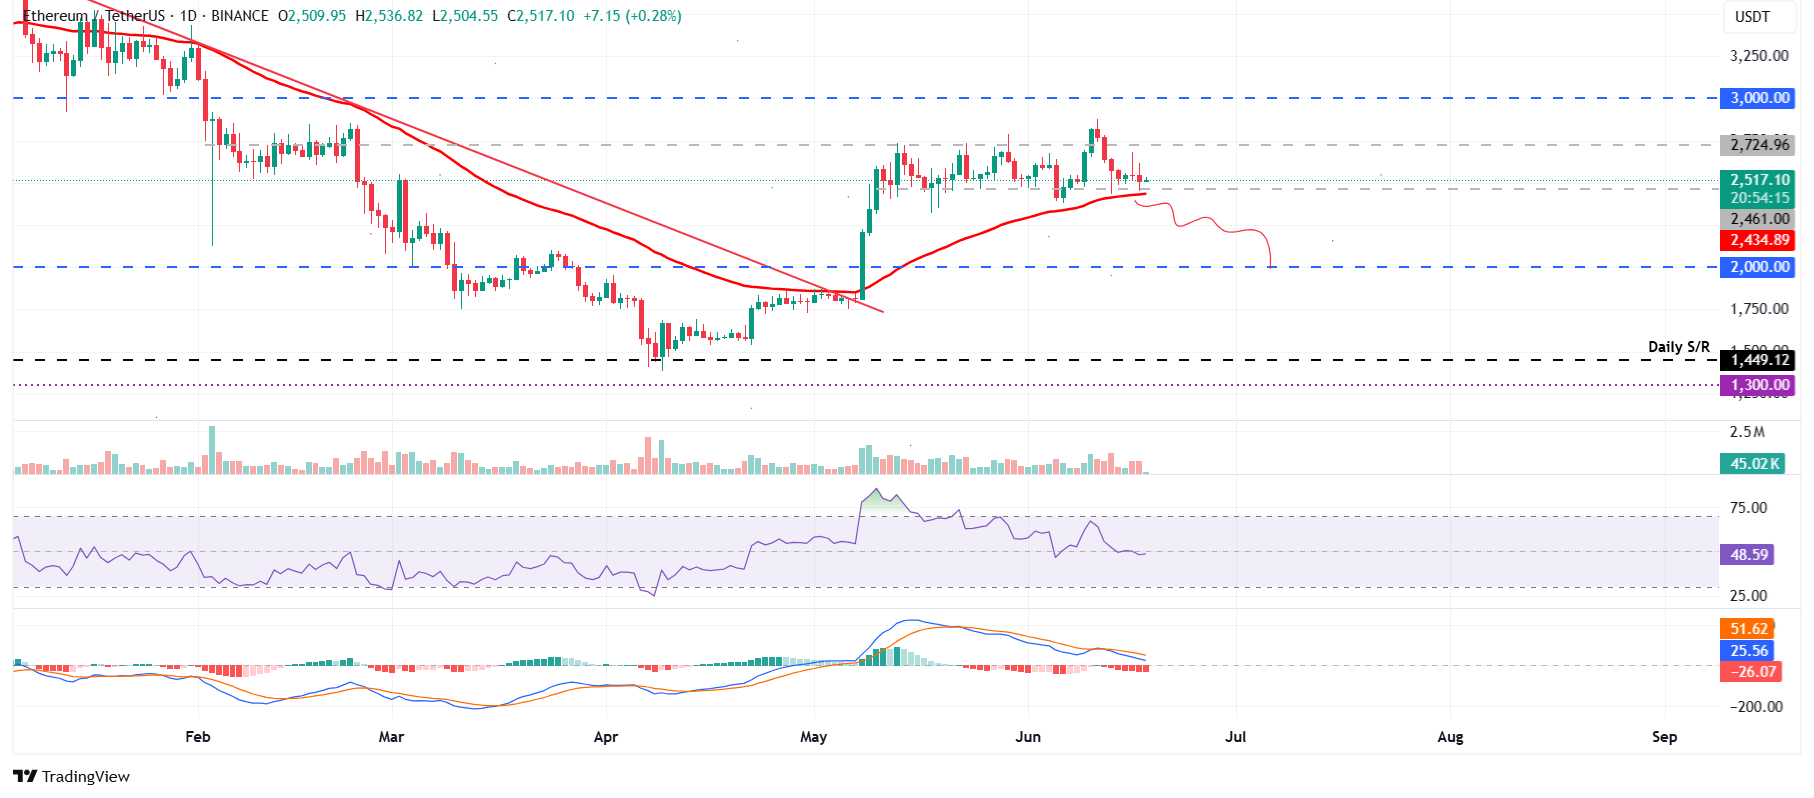
ETH/USDT daily chart
On the other hand, if ETH finds support around its lower consolidation boundary at $2,461, it could extend the recovery to retest its upper consolidation boundary at $2,724.
XRP is poised for a downleg below its 50-day EMA
XRP price attempted to close above the 50-day EMA at $2.24 on Monday but failed, subsequently declining by 3.53% the following day. At the time of writing on Wednesday, it trades at around $2.16.
If XRP continues its correction, it could extend the decline to retest its next daily support level at $1.96.
The RSI on the daily chart reads 44, below its neutral level and points downward, indicating strong bearish momentum. Moreover, the MACD indicator on the daily chart displayed a bearish crossover, signaling a sell and indicating a downward trend.
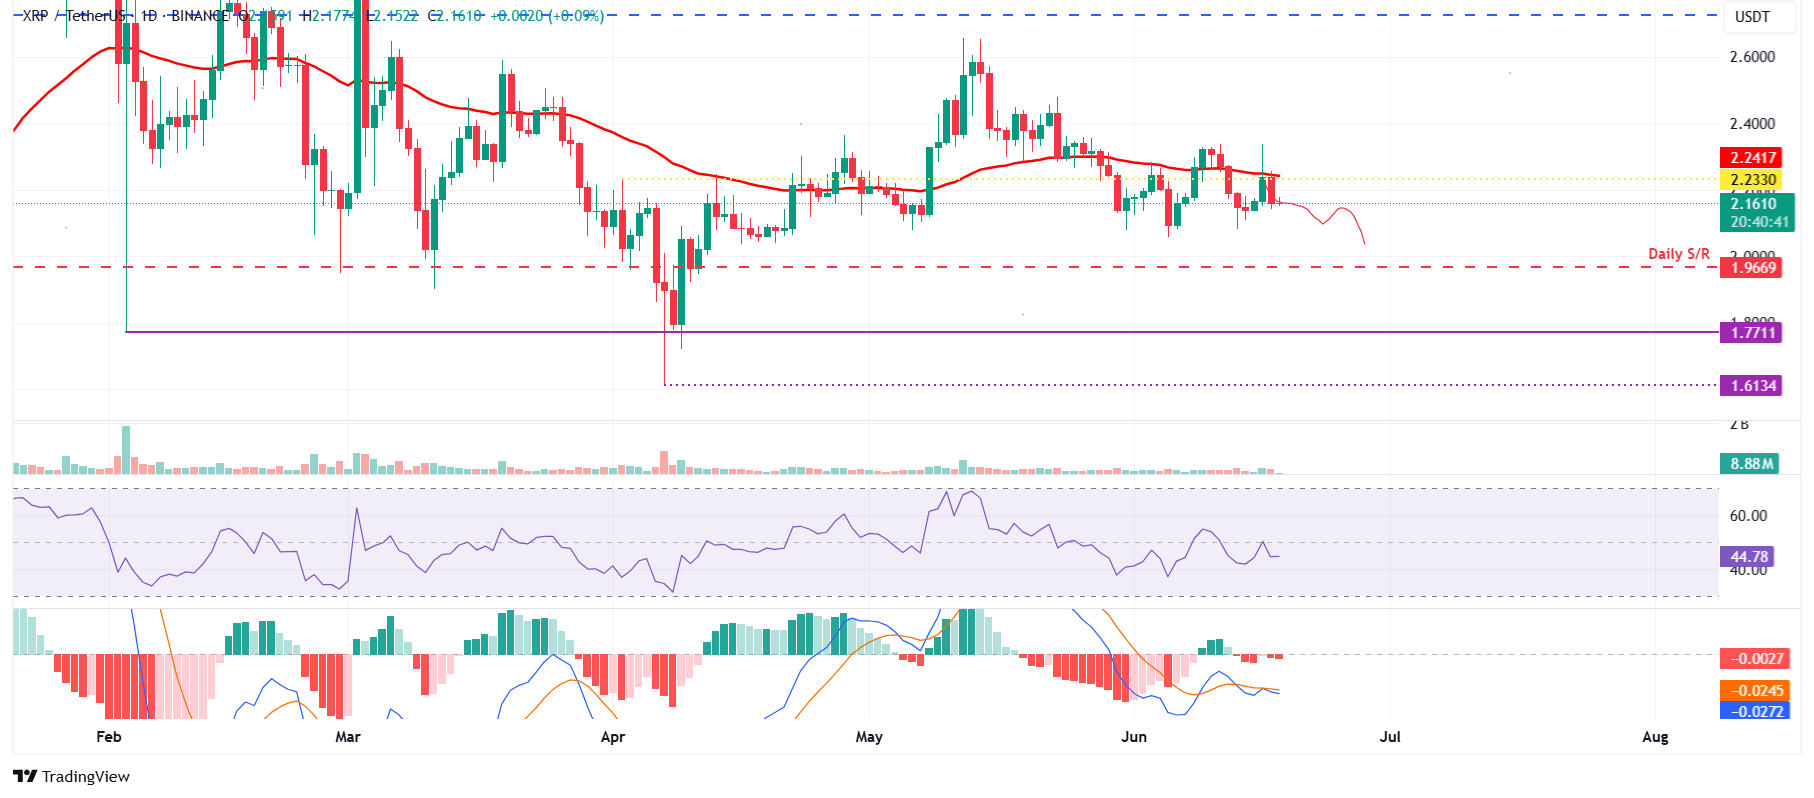
XRP/USDT daily chart
However, if XRP recovers, it could extend to retest its 50-day EMA at $2.25.
Read more
* The content presented above, whether from a third party or not, is considered as general advice only. This article should not be construed as containing investment advice, investment recommendations, an offer of or solicitation for any transactions in financial instruments.


