

Top 3 Price Prediction Bitcoin, Ethereum, Ripple: BTC, ETH and XRP momentum indicators show bearish signs
- Bitcoin price has been consolidating between $94,000 and $100,000 since early February.
- Ethereum price trades around $2,700 on Monday after rallying almost 6% last week.
- XRP faces rejection from its daily resistance level at $2.72, hinting at a downleg ahead.
Bitcoin (BTC) price has been consolidating between $94,000 and $100,000 since early February. Ethereum (ETH) and Ripple (XRP) show signs of weakness in momentum indicators, hinting at a downturn ahead.
Bitcoin price could face a correction if it closes below the $94,000 mark
Bitcoin price has been consolidating between $94,000 and $100,000 for almost three weeks. At the time of writing on Monday, it trades slightly down around $95,600.
If BTC breaks and closes below the lower boundary of the consolidating range of $94,000, it could extend the decline to test its psychologically important level of $90,000.
The Relative Strength Index (RSI) on the daily chart reads 43, below its neutral level of 50 and points downwards, indicating rising bearish momentum. The Moving Average Convergence Divergence (MACD) indicator coils around itself on the daily chart, indicating indecisiveness among the traders.
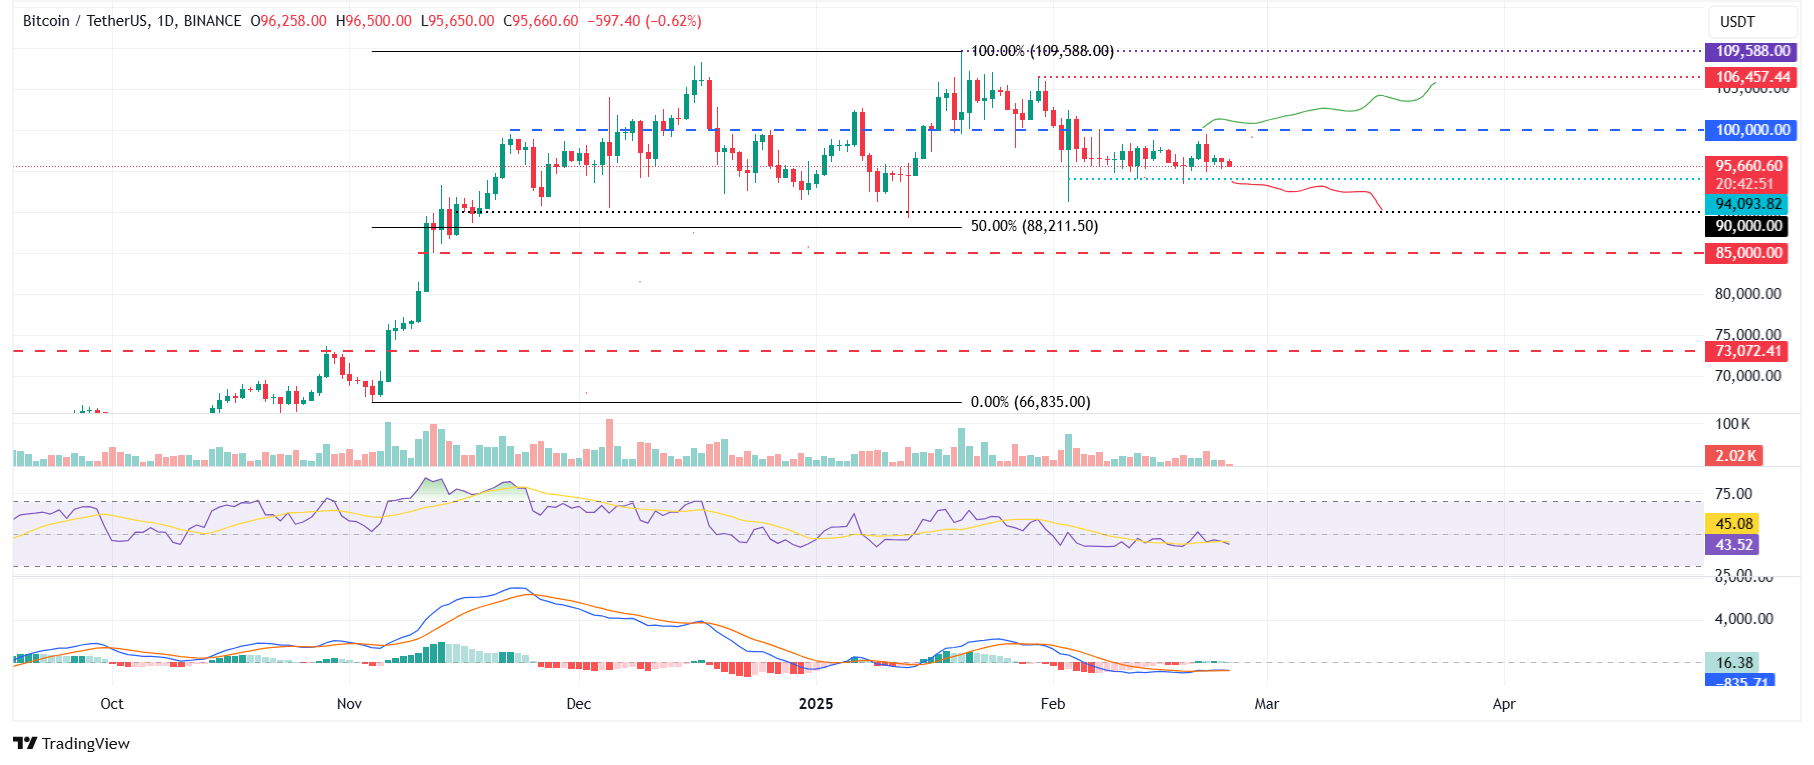
BTC/USDT daily chart
However, if BTC recovers and breaks above the upper boundary of the consolidating range of $100,000, it will extend the recovery to retest its January 30 high of $106,457.
Ethereum price RSI reflects weakness in momentum
Ethereum price continued to recover by almost 6% last week. However, at the start of this week on Monday, it declines slightly, trading around $2,754.
If ETH continues its pullback, it could extend the decline to retest its next daily support at $2,359.
The RSI on the daily chart supports ETH decline as it reads 46, facing rejection from its neutral level of 50 on Sunday and points downwards, indicating a bearish momentum.
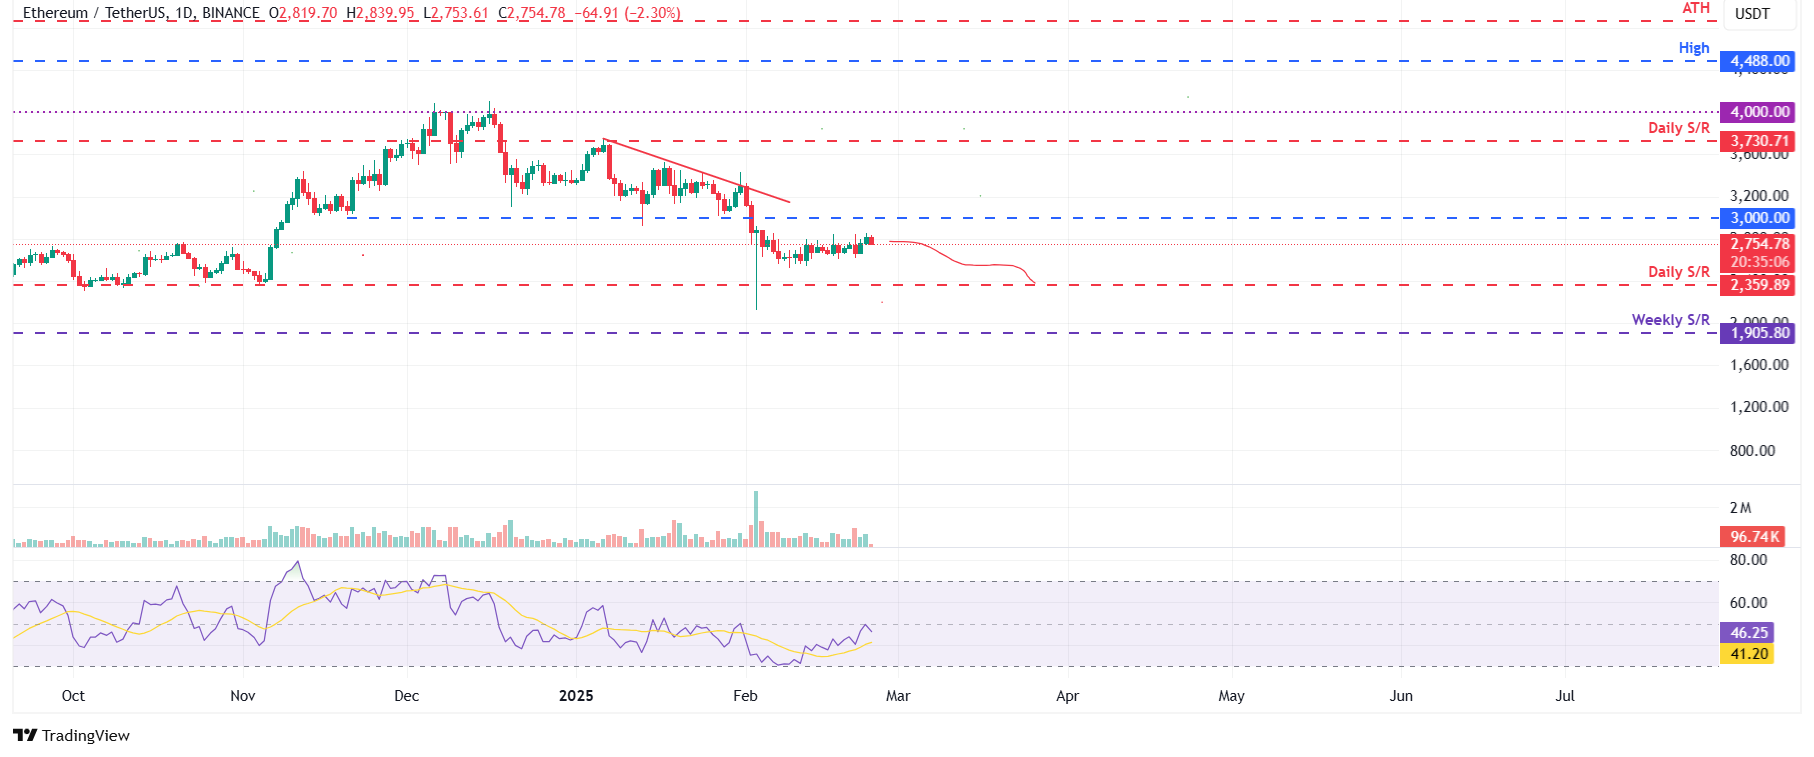
ETH/USDT daily chart
On the other hand, if ETH continues to recover, it could extend the recovery to test the $3,000 level.
Ripple is set for a decline if price fails to surpass$2.72 resistance
Ripple price declined 5.57% last week after facing rejection from its daily resistance level of $2.72. At the time of writing on Monday, it continues its decline, trading around $2.49.
If the daily level of $2.72 holds as resistance, it will extend the decline to test its next support level at $1.96.
The RSI on the daily chart reads 42, rejecting its neutral level of 50 and points downwards, indicating bearish momentum. Like Bitcoin, the MACD indicator coils around each other on the daily chart, indicating indecisiveness among the traders.
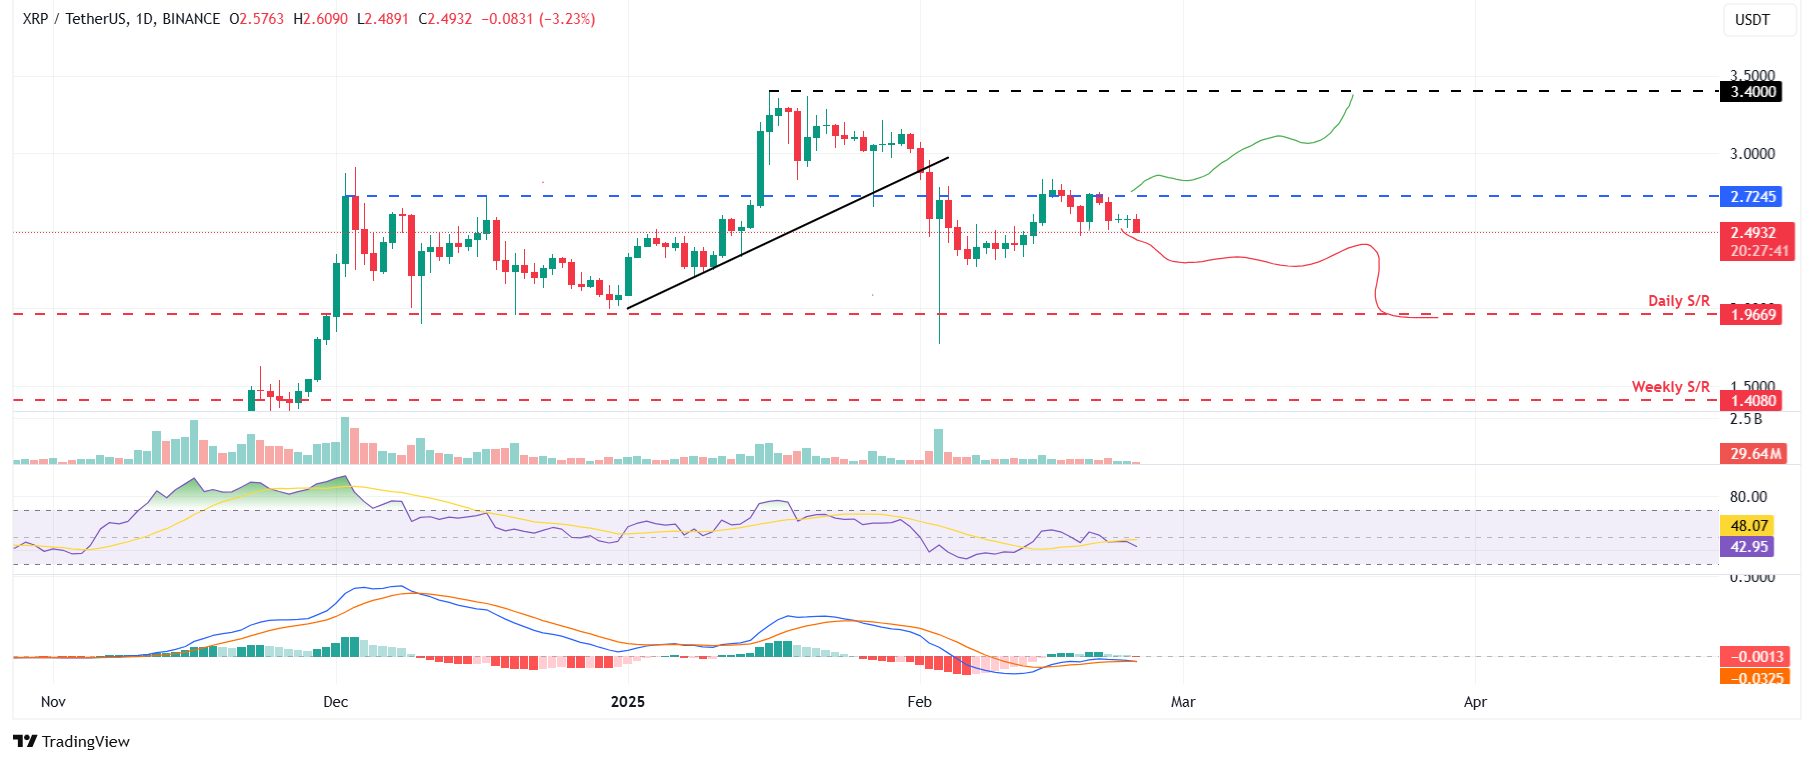
XRP/USDT daily chart
Conversely, if XRP closes above $2.72 and finds support, it will extend the rally to retest its January 16 high of $3.40.
Bitcoin, altcoins, stablecoins FAQs
Bitcoin is the largest cryptocurrency by market capitalization, a virtual currency designed to serve as money. This form of payment cannot be controlled by any one person, group, or entity, which eliminates the need for third-party participation during financial transactions.
Altcoins are any cryptocurrency apart from Bitcoin, but some also regard Ethereum as a non-altcoin because it is from these two cryptocurrencies that forking happens. If this is true, then Litecoin is the first altcoin, forked from the Bitcoin protocol and, therefore, an “improved” version of it.
Stablecoins are cryptocurrencies designed to have a stable price, with their value backed by a reserve of the asset it represents. To achieve this, the value of any one stablecoin is pegged to a commodity or financial instrument, such as the US Dollar (USD), with its supply regulated by an algorithm or demand. The main goal of stablecoins is to provide an on/off-ramp for investors willing to trade and invest in cryptocurrencies. Stablecoins also allow investors to store value since cryptocurrencies, in general, are subject to volatility.
Bitcoin dominance is the ratio of Bitcoin's market capitalization to the total market capitalization of all cryptocurrencies combined. It provides a clear picture of Bitcoin’s interest among investors. A high BTC dominance typically happens before and during a bull run, in which investors resort to investing in relatively stable and high market capitalization cryptocurrency like Bitcoin. A drop in BTC dominance usually means that investors are moving their capital and/or profits to altcoins in a quest for higher returns, which usually triggers an explosion of altcoin rallies.
Recommended Articles


