Stellar Price Forecast: XLM’s Total Value Locked reaches over $62 million

Source Fxstreet
  • Stellar price is trading inside a channel; a breakout would indicate bullish momentum.
  • DefiLlama data show that XLM’s TVL reached $62 million. 
  • The technical outlook projects a target of $0.74.

Stellar (XLM) price trades inside a channel pattern; a breakout indicates bullish momentum. Crypto intelligence tracker DefiLlama data shows that XLM’s TVL reaches $62 million while the technical outlook projects a target of $0.74.

Stellar price could move higher on channel breakout

Stellar price trades inside a channel pattern formed by connecting multiple highs and lows with two trendlines from late November. This technical pattern breakout favors the bulls, and the target is generally obtained by measuring the distance between the first daily high and the first daily low to the breakout point. Moreover, XLM’s price has been retested, and support for its 200-day Exponential Moving Average (EMA) has been found at $0.284. At the time of writing on Thursday, it trades at around $0.343.

If XLM breaks decisively and closes above the parallel channel pattern around the $0.416 level, it could rally 77% to test its technical target at $0.740.

The Relative Strength Index (RSI) on the daily chart reads 45, bouncing off its oversold level of 30 last week, indicating mild strength in bullish momentum. For the bullish momentum to be sustained, the RSI must trade above its neutral level of 50 for the rally to continue.

The Moving Average Convergence Divergence (MACD) indicator, which shows a bullish crossover on the daily chart, further supports Stellar’s bullish outlook. The MACD line (blue line) trades above the signal line (yellow line), suggesting the bulls are buying. Additionally, it shows rising green histogram bars above its neutral line zero, indicating bullish momentum.
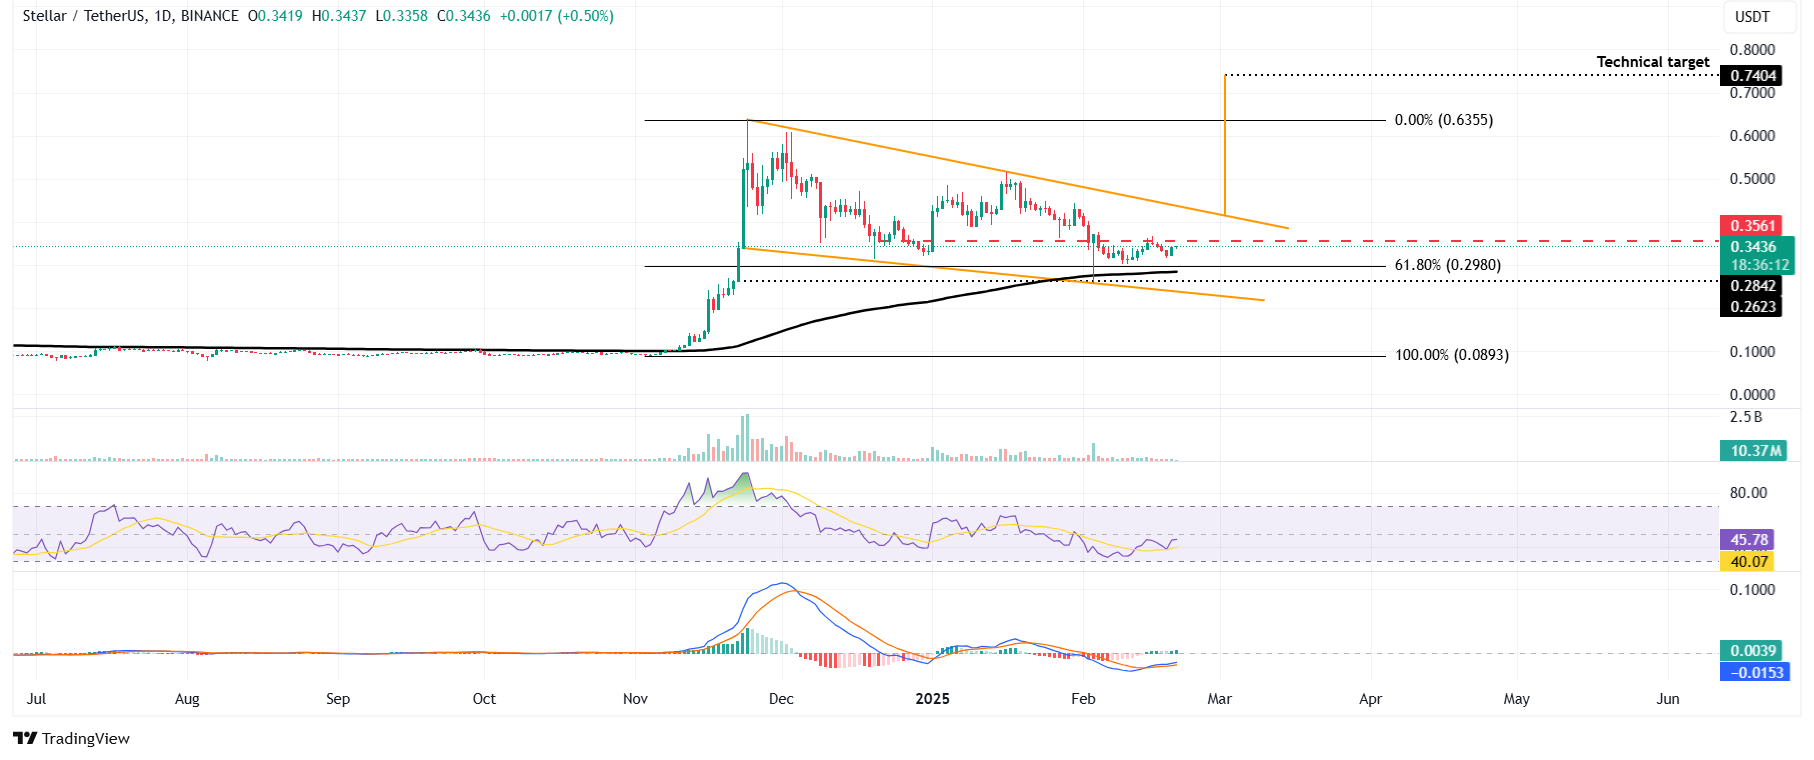
XLM/USDT daily chart

XLM/USDT daily chart

Crypto intelligence tracker DefiLlama data shows that XLM’s TVL increased from $53.57 million on February 9 to $61.84 million on Thursday, constantly rising since February 3.

This increase in TVL indicates growing activity and interest within the Stellar ecosystem. It suggests that more users deposit or utilize assets within XLM-based protocols, adding credence to the bullish outlook.
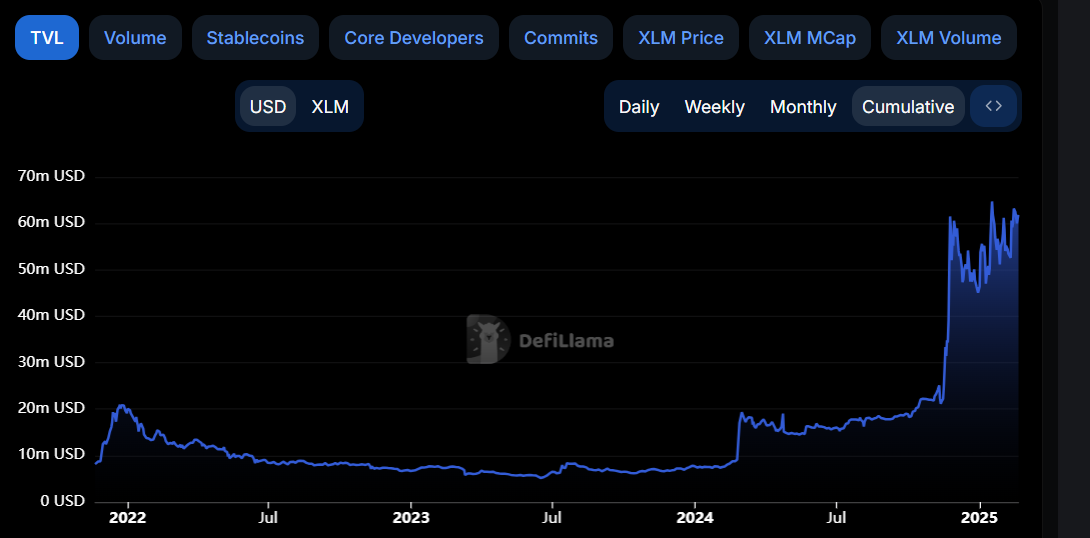
Stellar TVL chart. Source: DefiLlama

Stellar TVL chart. Source: DefiLlama

Disclaimer: For information purposes only. Past performance is not indicative of future results.
placeholder
AUD/USD: Current price action is likely the early stages of a recovery – UOB GroupAustralian Dollar (AUD) is likely to trade in a sideways range between 0.6220 and 0.6290. In the longer run, current price action is likely the early stages of a recovery phase that could potentially reach 0.6350, UOB Group’s FX analysts Quek Ser Leang and Lee Sue Ann note.
Author  FXStreet
Jan 22, Wed
Australian Dollar (AUD) is likely to trade in a sideways range between 0.6220 and 0.6290. In the longer run, current price action is likely the early stages of a recovery phase that could potentially reach 0.6350, UOB Group’s FX analysts Quek Ser Leang and Lee Sue Ann note.
placeholder
Five bullish Shiba Inu (SHIB) Price Predictions for April 2025SHIB price targets diverge as investors weigh Shibarium L3 upgrades, burn-rate surges, and altcoin market sentiment. Forecasts range from a conservative $0.000012 to a parabolic $0.00030.
Author  FXStreet
Apr 16, Wed
SHIB price targets diverge as investors weigh Shibarium L3 upgrades, burn-rate surges, and altcoin market sentiment. Forecasts range from a conservative $0.000012 to a parabolic $0.00030.
placeholder
Ethereum Price Stays Resilient — Upside Break May Be AheadEthereum price started a downside correction below the $1,780 level. ETH is now consolidating near the $1,800 zone and might aim for a move above $1,820.
Author  NewsBTC
Yesterday 03: 52
Ethereum price started a downside correction below the $1,780 level. ETH is now consolidating near the $1,800 zone and might aim for a move above $1,820.
placeholder
Gold price slides back closer to $3,300 amid tariff deals optimismGold price (XAU/USD) struggles to capitalize on the previous day's bounce from the vicinity of the $3,265-3,260 pivotal support and attracts fresh sellers during the Asian session on Tuesday.
Author  FXStreet
21 hours ago
Gold price (XAU/USD) struggles to capitalize on the previous day's bounce from the vicinity of the $3,265-3,260 pivotal support and attracts fresh sellers during the Asian session on Tuesday.
placeholder
EUR/USD ticks lower despite uncertainty over US-China tradeEUR/USD edges lower to near 1.1400 during European trading hours on Tuesday. The major currency pair ticks lower as the US Dollar (USD) steadies, but remains broadly on edge amid escalating uncertainty about the trade outlook between the United States (US) and China.
Author  FXStreet
18 hours ago
EUR/USD edges lower to near 1.1400 during European trading hours on Tuesday. The major currency pair ticks lower as the US Dollar (USD) steadies, but remains broadly on edge amid escalating uncertainty about the trade outlook between the United States (US) and China.
goTop
quote