


Bitcoin Weekly Forecast: BTC correction amid over $1 billion ETF outflows
- Bitcoin price consolidates above key support at $111,980 on Friday after falling over 3% so far this week.
- The correction comes amid slowing demand and profit-taking, with spot Bitcoin ETFs recording outflows of over $1.15 billion.
- Market participants await Fed Powell’s speech at the Jackson Hole Symposium for fresh cues on the rate path.
Bitcoin (BTC) price remains under pressure this week, consolidating above $111,980 support after dropping more than 3%. BTC pullback continued as weakening demand and profit-taking keep weighing in, as spot Exchange Traded Funds (ETFs) saw over $1.15 billion in outflows. Traders now look to Federal Reserve (Fed) Chair Jerome Powell’s upcoming speech at the Jackson Hole Symposium this Friday, which could provide fresh cues for the next directional move for riskier assets such as Bitcoin.
Bitcoin spot ETFs record the highest weekly outflow in five months
Bitcoin price continued its correction so far this week, falling over 3% and reaching a low of $112,015 on Thursday, having declined nearly 8% from its all-time high of $124,747 on August 14. The falling institutional demand fueled this price pullback. SoSoValue data shows that Bitcoin Spot ETFs have recorded a total of $1.15 billion in outflows until Thursday, the highest outflow since early March. If this outflow continues and intensifies, BTC could see further correction ahead.
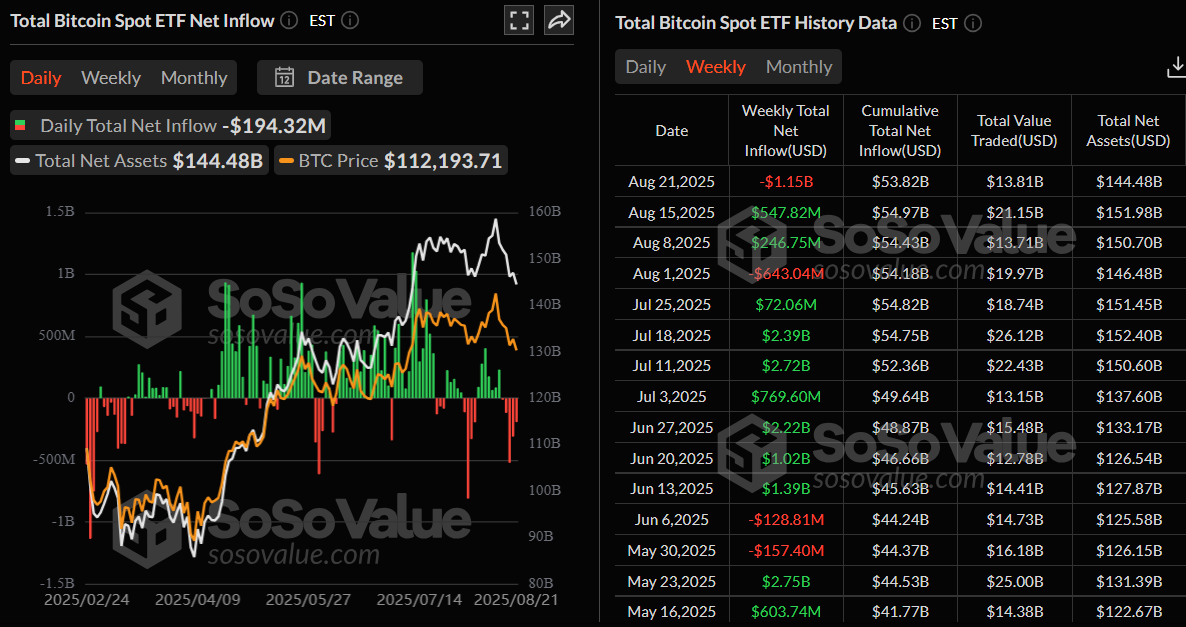
Total Bitcoin Spot ETF Net Inflow weekly chart. Source: SoSoValue
On-chain data shows profit-taking activity fuels BTC correction
CryptoQuant’s weekly report on Wednesday highlighted that slowing demand and profit-taking are key drivers of the BTC correction.
The graph below shows that the BTC demand is continuing to weaken. Bitcoin Apparent Demand has dropped from its July peak of 174,000 BTC to 59,000 BTC on Wednesday. During the same period, the demand from major institutional buyers has also slowed, with 30-day ETF net purchases (red) standing at 11,000 BTC, their lowest level since April 25, and Strategy’s accumulation (grey) falling sharply from 171,000 BTC in November 2024 highs to 27,000 in the last 30 days, suggests fading momentum, which likely contributed to the recent price correction. If demand continues to soften, Bitcoin could remain in a consolidation phase or see further correction.
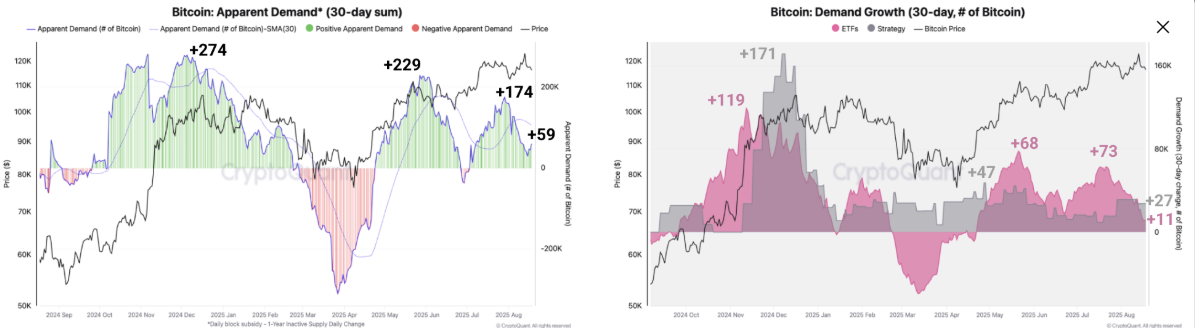
Bitcoin Apparent demand 30-day sum (left) chart. Bitcoin Demand growth 30-day (right) chart. Source: CryptoQuant
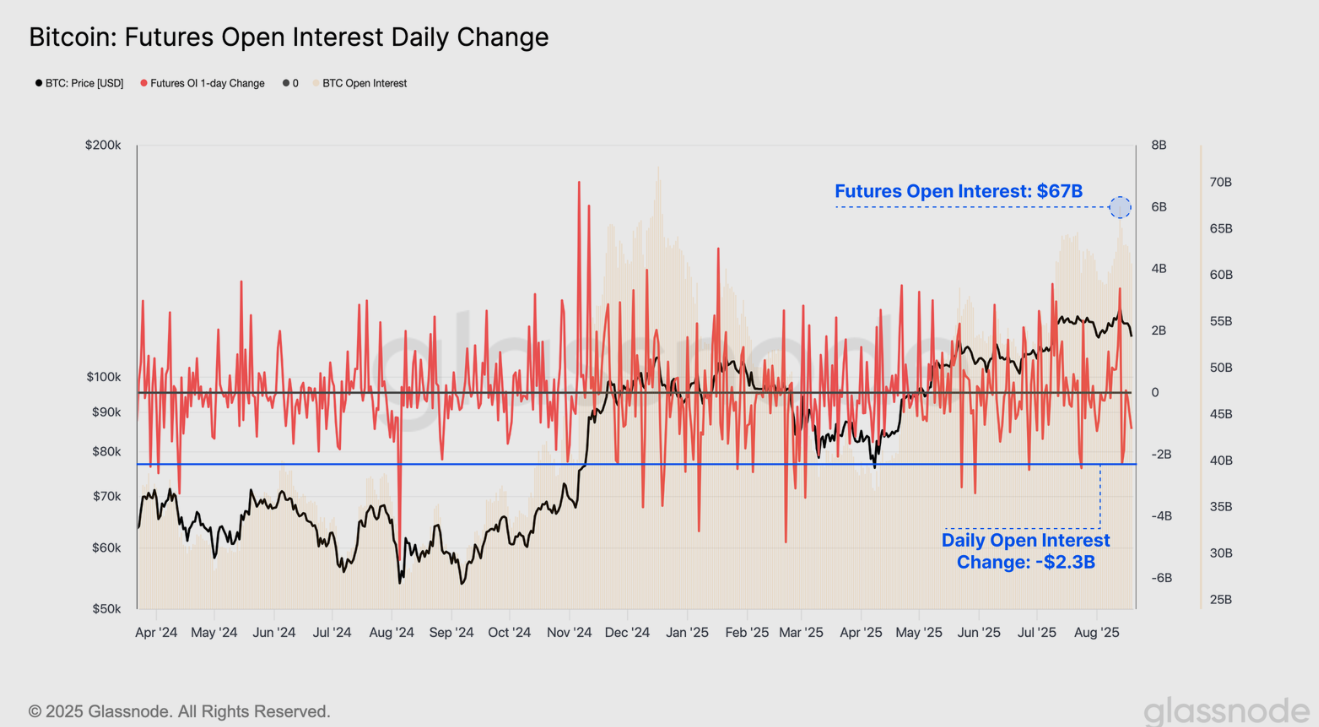
Glassnode’s report this week also supported this bearish thesis. The graph below shows that Open Interest (OI) across Bitcoin futures contracts remains elevated at $67 billion, suggesting overheated leveraged conditions and even moderate price movements can trigger a significant contraction in leveraged positions.
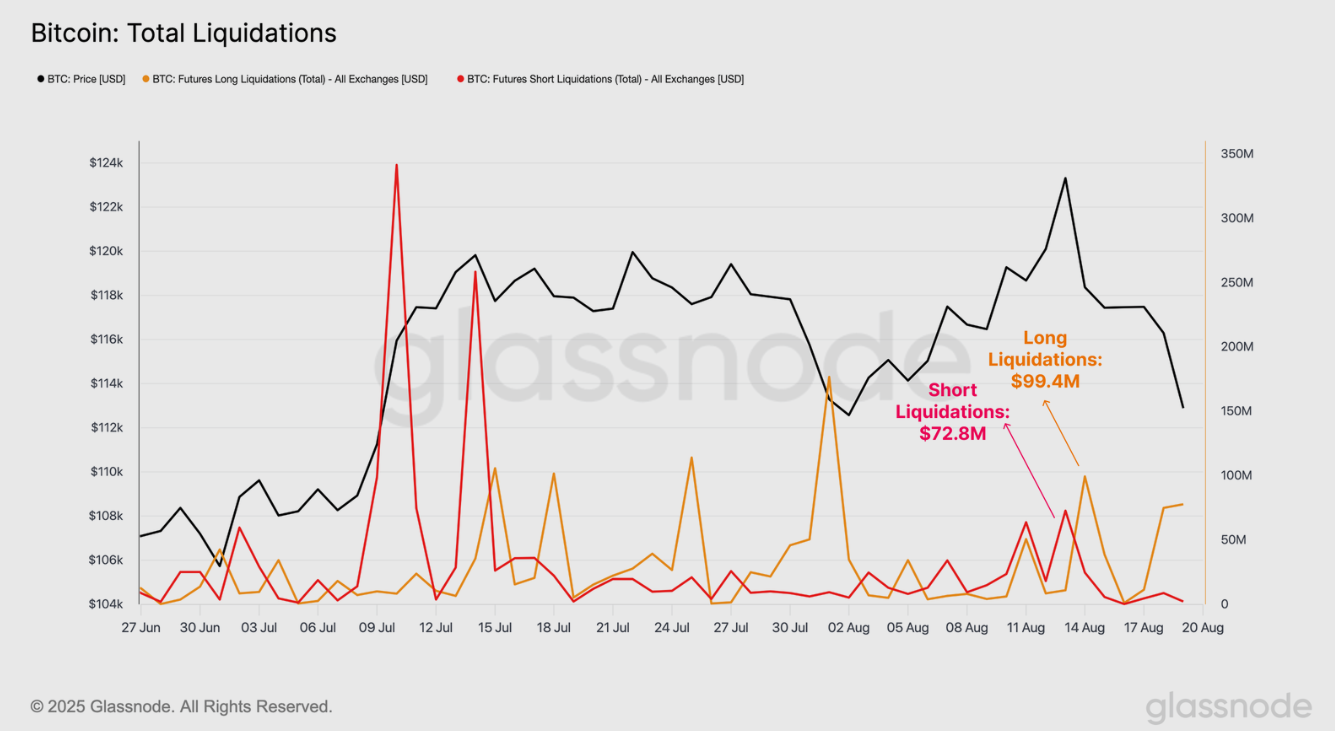
The report further explained that while liquidation volumes were triggered during this correction, with shorts reaching $72.8 million across the record high, and longs hitting $99 million during the downtrend, they remained low compared to those seen during similar volatile price moves in July. This suggests that a significant portion of recent contract closures were likely voluntary, and therefore risk-managed, rather than driven by forced liquidations as excessive leverage is flushed out.
Bitcoin slides after hawkish FOMC stance
On the macroeconomic front, the minutes from the late-July Federal Open Market Committee (FOMC) meeting, released on Wednesday, struck a hawkish tone. Policymakers expressed greater concern over persistent inflation than over the labor market, fueling downside pressure on riskier assets such as Bitcoin.
This hawkish stance comes after last week’s US Producer Price Index (PPI) data figures significantly exceeded economists’ expectations, suggesting that inflation is gradually escalating in the pipeline, which led BTC to slide 1.58% last week. According to the CME FedWatch tool, the odds of a 25 basis points (bps) interest rate cut currently stand at 73.4%, down from 98% last week.
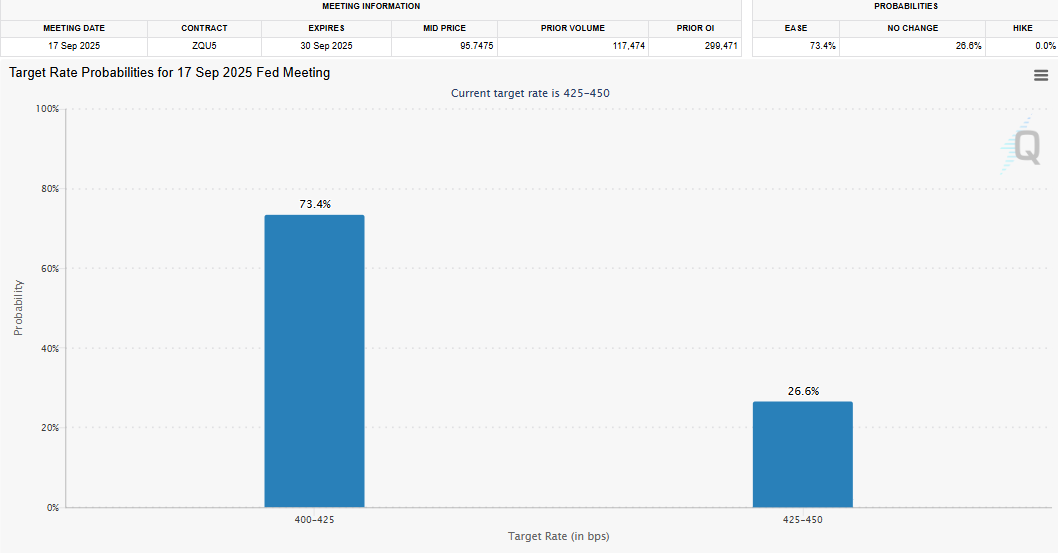
Traders remain cautious as Bitcoin is showing muted momentum, looking for Fed Chair Jerome Powell’s much-anticipated speech at the Jackson Hole Symposium this Friday to get fresh cues on the future interest rate path.
Some signs of optimism
Despite BTC continuing its correction this week, treasury companies such as Metaplanet and Strategy had added a total of 1,185 BTC on Monday, comfortably buying at these price dips.

During the same period, CMB International Securities, a subsidiary of China Merchants Bank, announced the official launch of virtual asset trading in Hong Kong, supporting trading of BTC, ETH, and USDT. This announcement marks a milestone as it becomes the first Chinese bank-affiliated brokerage firm to carry out this business in compliance, covering mainstream currencies such as Bitcoin and Ethereum.
Additionally, the news that US President Donald Trump is setting the stage for a trilateral meeting with Russia and Ukraine came in. This raises hopes for a breakthrough towards ending the protracted Russia-Ukraine war and could help risk-on sentiment, which could boost investors’ confidence and rally in cryptocurrencies such as Bitcoin.
Is BTC out of the woods?
BTC price has fallen over 8% from its record of $124,747 on August 14, closing below an ascending trendline drawn by connecting multiple lows since early April this week, and retested its support level at $111,980 on Thursday. At the time of writing on Friday, it hovers at around $113,200.
If the support at $111,980 holds and BTC recovers and closes above its 50-day Exponential Moving Average (EMA) at $114,788, it could extend the recovery toward its next daily resistance at $116,000.
However, the Relative Strength Index (RSI) reads 42, below its neutral value of 50, suggesting bearish momentum. For the recovery rally to be sustained, the RSI must move above its neutral level.
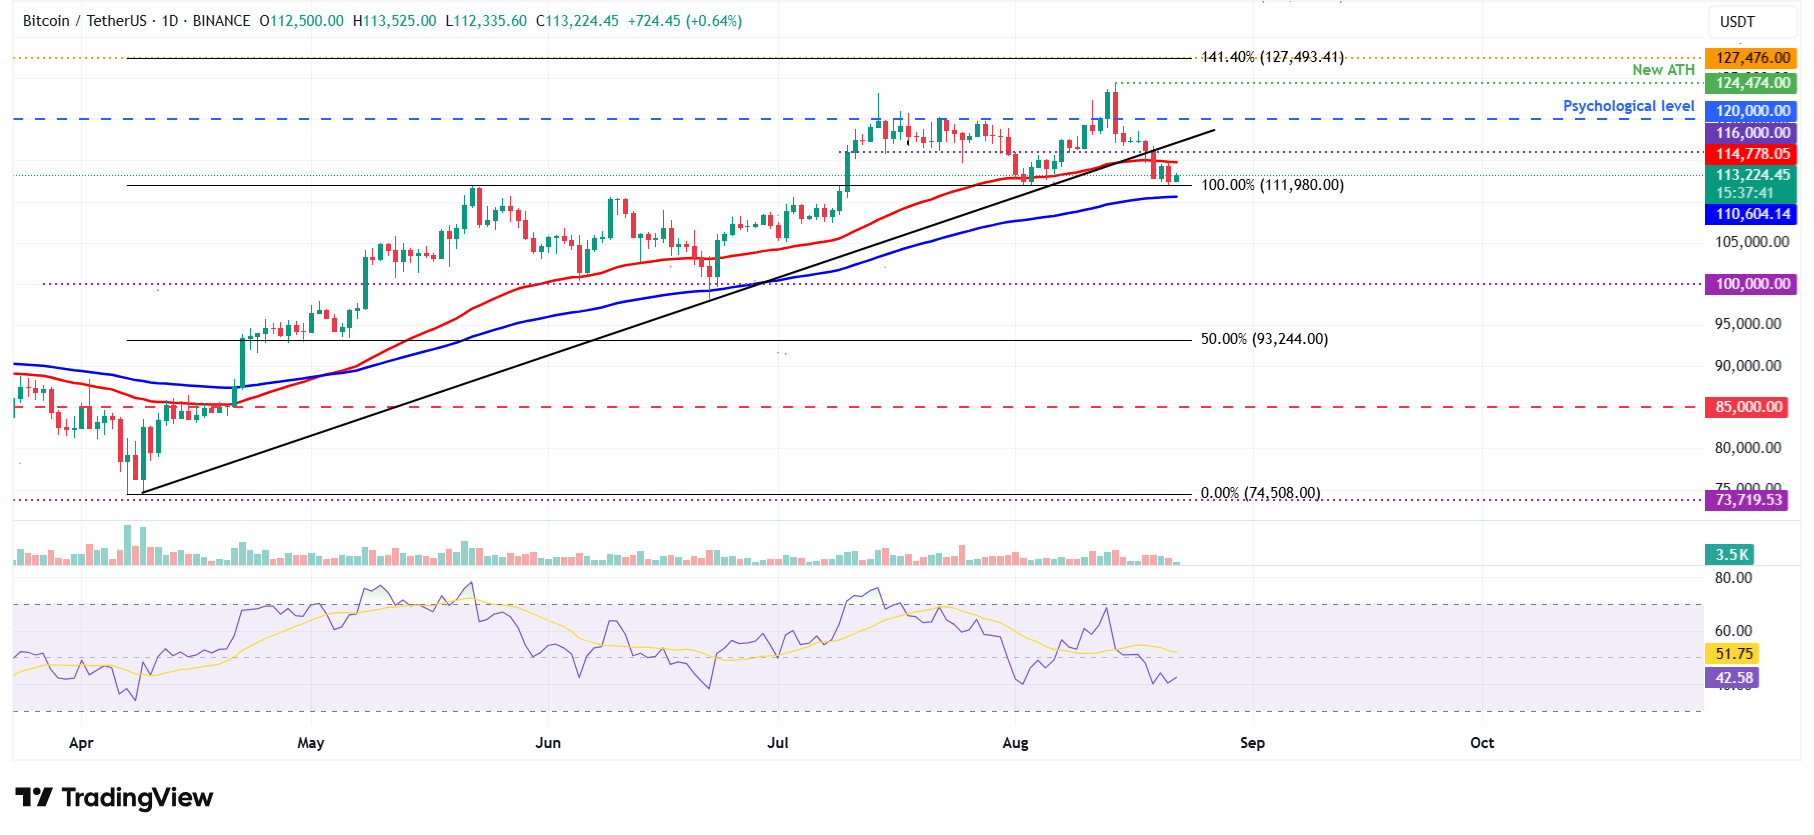
BTC/USDT daily chart
However, if BTC continues its correction and closes below $111,980 support, it could extend the decline toward its 100-day EMA at $110,604.
Cryptocurrency prices FAQs
Token launches influence demand and adoption among market participants. Listings on crypto exchanges deepen the liquidity for an asset and add new participants to an asset’s network. This is typically bullish for a digital asset.
A hack is an event in which an attacker captures a large volume of the asset from a DeFi bridge or hot wallet of an exchange or any other crypto platform via exploits, bugs or other methods. The exploiter then transfers these tokens out of the exchange platforms to ultimately sell or swap the assets for other cryptocurrencies or stablecoins. Such events often involve an en masse panic triggering a sell-off in the affected assets.
Macroeconomic events like the US Federal Reserve’s decision on interest rates influence crypto assets mainly through the direct impact they have on the US Dollar. An increase in interest rate typically negatively influences Bitcoin and altcoin prices, and vice versa. If the US Dollar index declines, risk assets and associated leverage for trading gets cheaper, in turn driving crypto prices higher.
Halvings are typically considered bullish events as they slash the block reward in half for miners, constricting the supply of the asset. At consistent demand if the supply reduces, the asset’s price climbs.
Recommended Articles


