
Bitcoin Price Forecast: BTC steadies at $113,500 as traders await Powell’s Jackson Hole speech


Bitcoin price holds near $113,500 after losing 3% so far this week.
On-chain data points to slowing demand and profit-taking as key drivers of the correction.
Market focus shifts to flash S&P Global PMIs and Fed Chair Jerome Powell’s upcoming speech at the Jackson Hole Symposium.
Bitcoin (BTC) steadies around $113,500 at the time of writing on Thursday after falling 3% so far this week. On-chain data shows that weakening demand and profit-taking continue to weigh on BTC. Meanwhile, traders await the preliminary S&P Global Purchasing Managers' Index (PMI) data later in the day and clarity from Federal Reserve (Fed) Chair Jerome Powell’s speech at the Jackson Hole Symposium on Friday, which could provide fresh cues for the next directional move for riskier assets such as Bitcoin.
Bitcoin trades cautious after hawkish FOMC stance
Bitcoin price stabilizes around $113,500 at the writing on Thursday after falling over 8% from its all-time high of $124,474, set on August 14, and reaching a low of $112,380 on Wednesday. Traders take a cautious stance as the Minutes from the late July Federal Open Market Committee (FOMC) policy meeting, released on Wednesday, read on the hawkish side, with participants more worried about inflation than the labour market.
Last week’s US Producer Price Index (PPI) data figures significantly exceeded economists’ expectations, suggesting that inflation is gradually escalating in the pipeline, which had fueled the correction in riskier assets such as BTC.
With BTC showing muted momentum, traders remain cautious, turning to the flash S&P Global PMIs on Thursday for potential cues ahead of Fed Chair Jerome Powell’s much-anticipated Jackson Hole speech later this week.
Bitcoin’s falling demand and profit-taking activity fuel correction
CryptoQuant’s weekly report on Wednesday highlighted that slowing demand and profit-taking are key drivers of the correction.
The graph below shows that the BTC demand is continuing to weaken. Bitcoin Apparent Demand has dropped from its July peak of 174,000 BTC to 59,000 BTC on Wednesday. During the same period, the demand from major institutional buyers has also slowed, with 30-day ETF net purchases (red) standing at 11,000 BTC, their lowest level since April 25, and Strategy’s accumulation (grey) falling sharply from 171,000 BTC in November 2024 highs, to 27,000 in the last 30 days.
This falling in demand growth suggests fading momentum, which likely contributed to the recent price correction. If demand continues to soften, Bitcoin could remain in a consolidation phase or see further correction.
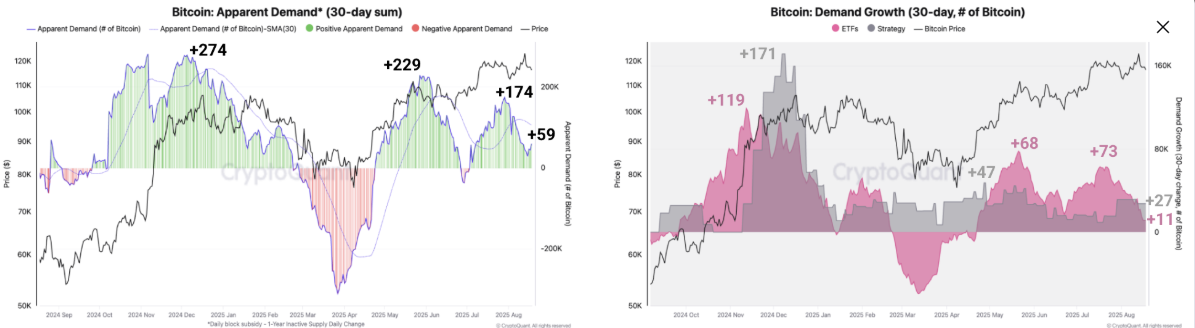
Bitcoin Apparent demand 30-day sum (left) chart. Bitcoin Demand growth 30-day (right) chart. Source: CryptoQuant
Apart from falling demand, the profit-taking activity also fueled the recent correction. Bitcoin holders’ daily realized profit spiked to $9 billion in July, the biggest daily profit so far this year. Moreover, during August, the daily profit-activity hits $3 billion, and on August 16, new whale investors realized $2 billion in profits, underscoring that profit-taking is ongoing.
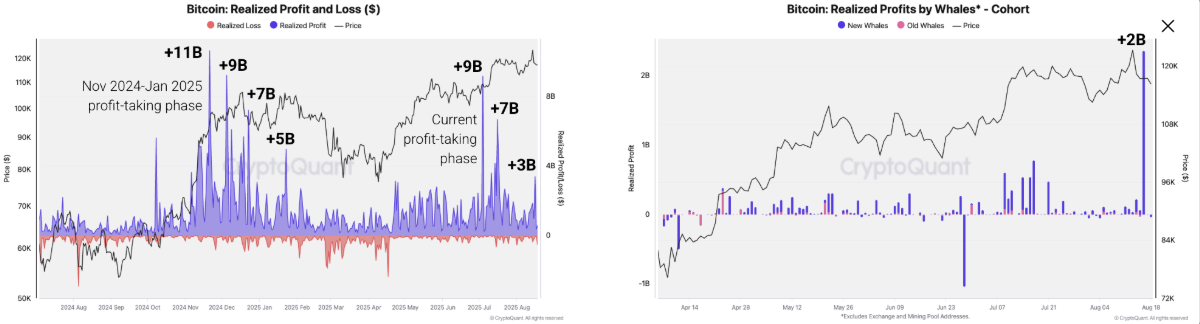
Bitcoin Realized Profit and Loss (Left) chart. Bitcoin realised profits by whales (right) chart. Source: CryptoQuant
How low can BTC go?
If Bitcoin continues its pullback, BTC may find support near $110,000. CryptoQuant data shows that this level at $110,000 represents the Trader On-chain Realized Price, which acts as a price support during bull markets. At this level, the unrealized profit margin of traders turns to zero, disincentivizing heavy selling from these market participants.
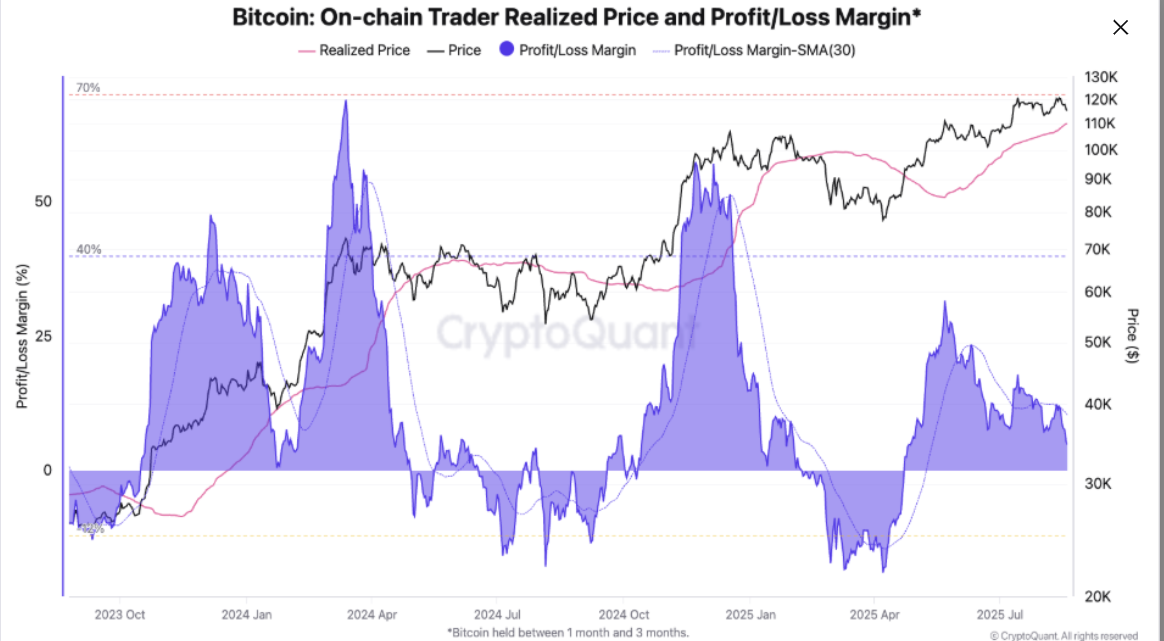
Bitcoin Trader On-chain Realized Price chart. Source: CryptoQuant
Bitcoin Price Forecast: BTC faces rejection from its 50-day EMA
Bitcoin price extended the decline on Tuesday, closing below an ascending trendline drawn by connecting multiple lows since early April. BTC has fallen over 8% from its record of $124,747 on August 14, reaching a low of $112,380 on Wednesday. At the time of writing on Wednesday, it faces rejection from its previously broken 50-day Exponential Moving Average (EMA) at $114,886.
If BTC continues its pullback, it could extend losses toward its next support level at $111,980.
The Relative Strength Index (RSI) reads 42 on the daily chart, below its neutral level of 50, indicating bearish momentum. Additionally, the Moving Average Convergence Divergence (MACD) showed a bearish crossover last week, suggesting a downward trend.
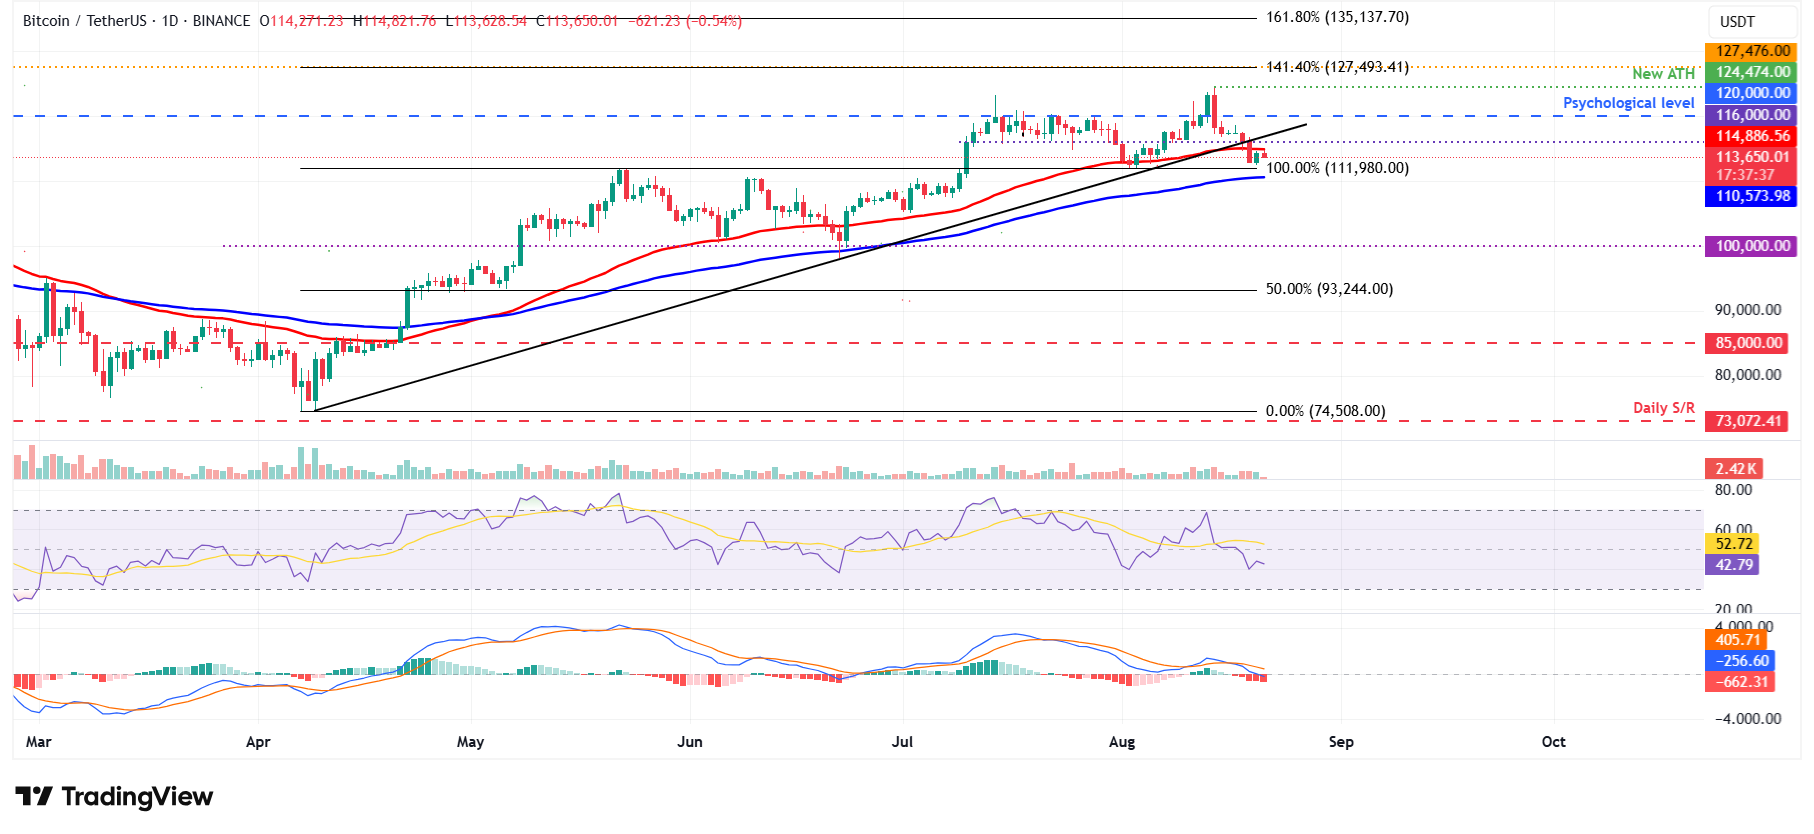
BTC/USDT daily chart
However, if BTC recovers, it could extend the recovery toward its daily level at $116,000.
* The content presented above, whether from a third party or not, is considered as general advice only. This article should not be construed as containing investment advice, investment recommendations, an offer of or solicitation for any transactions in financial instruments.


