


Ecomi price prediction 2025-2031: Is OMI to $1 possible?
Key takeaways:
- Our Ecomi price prediction anticipates a high of $0.000598 in 2025.
- In 2027, it will range between $0.001 and $0.0012, with an average price of $0.0011.
- In 2030, it will range between $0.0032 and $0.0038, with an average price of $0.0033.
ECOMI is a Singapore-based firm that offers the OMI coin, secure ECOMI wallets, and the VeVe platform. Its goal is to modernize popular culture by incorporating it into the Internet age, with NFTs (non-fungible tokens) and their development as its primary objectives. NFTs might have a significant future in ECOMI’s eyes, not just as digital artworks but also as interactive experiences — forget about putting digital art on a USB stick; think of creating real 3D artwork of your favorite characters in your virtual reality (VR) headsets, or battling virtual 3D NFT Pokémon cards.
Overview
| Cryptocurrency | Ecomi |
| Ticker | OMI |
| Current price | $0.0003483 |
| Market capitalization | $94.38M |
| Trading volume | $1.61M |
| Circulating supply | 270.94M |
| All-time high | $0.003035 on Apr 5, 2022 |
| All-time low | $0.0002607 on Noc 13, 2024 |
| 24-hour high | $0.0004175 |
| 24-hour low | $0.0003472 |
Ecomi price prediction: Technical analysis
| Metric | Value |
| Volatility (30-day variation) | 9.31% |
| 50-day SMA | $0.00044 |
| 200-day SMA | $0.000417 |
| Sentiment | Bearish |
| Fear and Greed Index | 77 (Extreme Greed) |
| Green days | 11/30 (37%) |
Ecomi price analysis: OMI maintains bear trend
OMI/USD 1-day chart: OMI drops gradually
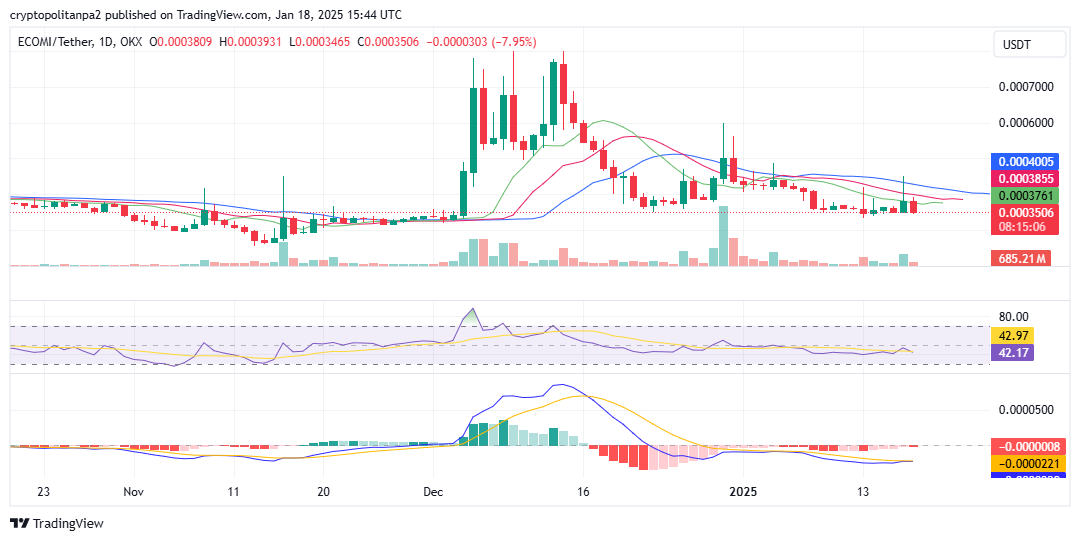
Ecomi price movements show it has consistently dropped since December after it peaked at $0.0008. The drop, however, was sharp and then gradual preventing it from falling into oversold territory. Something notable is an uptick in prices on Dec 30, 2024. The impact of the uptick remains unclear as the candles remain short, indicative of an indecisive market. The William alligator trendlines have converged, indicating little market volatility. The MACD supports the laid-back market, showing little market momentum.
OMI/USD 4-hour chart: OMI volatility drops
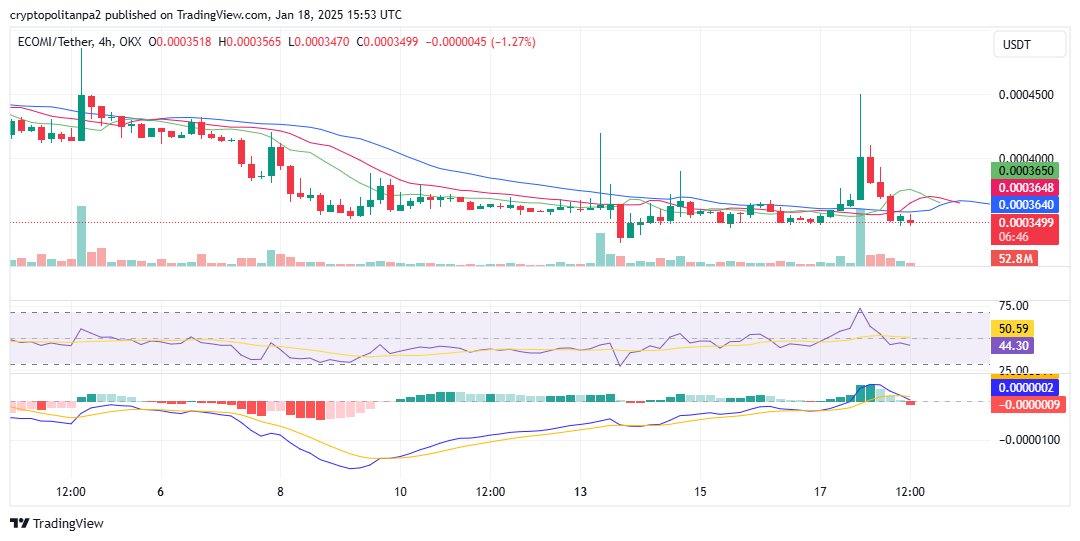
Zoomed in, OMI is erratic The trend can be seen in the RSI, which is zig-zagging between the upper and lower boundaries. The William alligator is closing, suggesting falling volatility, and the RSI is in neutral territory.
Ecomi technical indicators: Levels and action
Daily simple moving average (SMA)
| Period | Value ($) | Action |
| SMA 3 | 0.000368 | SELL |
| SMA 5 | 0.000364 | SELL |
| SMA 10 | 0.000376 | SELL |
| SMA 21 | 0.0003999 | SELL |
| SMA 50 | 0.00044 | SELL |
| SMA 100 | 0.000392 | SELL |
| SMA 200 | 0.000417 | SELL |
Daily exponential moving average (EMA)
| Period | Value ($) | Action |
| EMA 3 | 0.000363 | SELL |
| EMA 5 | 0.000368 | SELL |
| EMA 10 | 0.000381 | SELL |
| EMA 21 | 0.000403 | SELL |
| EMA 50 | 0.000414 | SELL |
| EMA 100 | 0.000412 | SELL |
| EMA 200 | 0.000443 | SELL |
Is Ecomi a good investment?
Ecomi OMI is the utility token for Veve, an app-based marketplace for premium licensed digital collectibles. It’s a good investment for users of the VeVe platform and speculative for users who choose to buy and hold.
Why is Ecomi up?
Ecomi run in the last few days can be traced to the recovering crypto market, marking a brief correction from the drop from the year’s high in March.
Will Ecomi reach $0.001?
Per the Cryptopolitan price prediction, Ecomi will rise above $0.001 in 2027.
Will Ecomi reach $0.01?
Per the Cryptopolitan price prediction, it remains improbable that Ecomi will get to $0.01 before 203 .
Will Ecomi reach $0.1?
Per the Cryptopolitan price prediction, it remains improbable that Ecomi will reach $0.1 before 2031.
Does Ecomi have a good long-term future?
According to Cryptopolitan price predictions, Ecomi will trade higher in years to come. However, factors like market crashes or difficult regulations could invalidate this bullish theory.
Ecomi OMI price prediction for January 2025
The Ecomi price forecast for January is a maximum price of $0.000380 and a minimum price of $0.000328. The average price for the month will be $0.000348.
| Month | Potential low ($) | Potential average ($) | Potential high ($) |
| January | 0.000328 | 0.000348 | 0.000380 |
Ecomi price prediction 2025
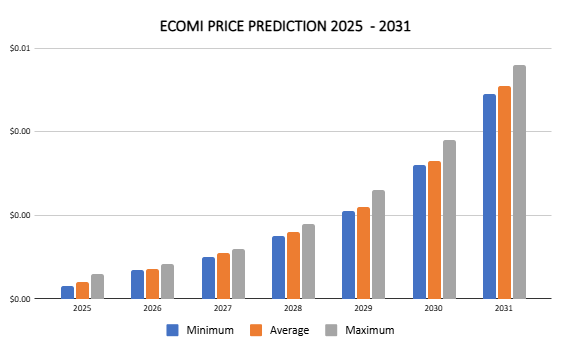
For 2025, Ecomi will range between $0.000306 and $0.000598, with an average price of $0.000404.
| Year | Potential low ($) | Potential average ($) | Potential high ($) |
| 2025 | 0.000306 | 0.000404 | 0.000598 |
Ecomi OMI price prediction: 2026-2031
| Year | Potential low ($) | Potential average ($) | Potential high ($) |
| 2026 | 0.000690 | 0.000711 | 0.000829 |
| 2027 | 0.001000 | 0.001100 | 0.001200 |
| 2028 | 0.001500 | 0.001600 | 0.001800 |
| 2029 | 0.002100 | 0.002200 | 0.002600 |
| 2030 | 0.003200 | 0.003300 | 0.003800 |
| 2031 | 0.004900 | 0.005100 | 0.005600 |
Ecomi price prediction 2026
The Ecomi prediction estimates it will range between $0.00069 and $0.000829, with an average price of $0.000711.
Ecomi OMI price prediction 2027
Ecomi coin price prediction climbs even higher into 2027. According to the predictions, Ecomi’s price will range between $0.001 and $0.0012, with an average price of $0.0011.
Ecomi prediction 2028
Our analysis indicates a further rise in OMI’s price. It will trade between $0.0015 and $0.0018, with an average price of $0.0016.
Ecomi crypto price prediction 2029
According to the OMI coin price prediction for 2029, the price of OMI will range between $0.0021 and $0.0026, with an average price of $0.0022.
Ecomi price prediction 2030
According to the Ecomi price prediction for 2030, the price of Ecomi will range between $0.0032 and $0.0038, with an average price of $0.0033.
Ecomi price prediction 2031
According to the Ecomi price prediction for 2031, the price of Ecomi will range between $0.0049 and $0.0056, with an average price of $0.0051.
Ecomi market price prediction: Analysts’ OMI price forecast
| Platform | 2025 | 2026 | 2027 |
| Digitalcoinprice | $0.000741 | $0.000837 | $0.00121 |
| Gate.io | $0.0003484 | $0.000418 | $0.0004452 |
Cryptopolitan Ecomi price predictions
Our predictions show that OMI will achieve a high of $0.000598 in 2025. In 2027, it will range between $0.001 and $0.0012, with an average of $0.0011. In 2030, it will range between $0.0032 and $0.0038, with an average price of $0.0033. Note the predictions are not investment advice. Seek independent professional consultation or do your own research.
Ecomi historic price sentiment
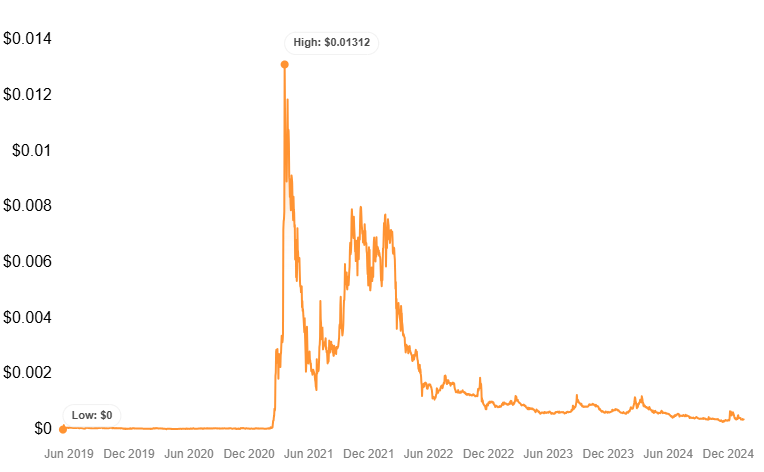
- According to Bitget, the Ecomi initial coin offering (ICO) took place on Bitforex turbo starter in May 2019. The ICO price was $0.00006972, and it raised $697,200.
- ECOMI’s VeVe platform launched in December 2020.
- In December 2021, VeVe re-minted all of its NFTs via Immutable X. The re-minting process occurred as part of what VeVe calls “Phases” of its Immutable X migration.
- ECOMI reached its highest price on March 19, 2021, when it was trading at its all-time high of $0.013384 during the 2021 bull run.
- From 2022, OMI turned bearish, consistently registering lower highs and lows, with instances of high breakouts that corrected later. By the end of 2022, it had fallen to $0.00082.
- In 2023 it registered two peaks at $0.001173 and $0.001156 in February and August, respectively. The year closed as it traded at the $0.00065 level.
- In 2024, it was bullish in Q1, reaching a peak of $0.0011 in March. In Q2, it shed all its earlier gains and traded at the $0.00048 level.
- The bear run continued and it reached its all-time low at $0.0002607 on Nov 13, 2024.
- It made a sharp recovery in December reaching a high of $0.0007431, but quickly corrected into 2025 dropping back to the $0.0003488 mark.
Recommended Articles


