

Bitcoin Price Prediction: Bulls mount $721M leverage amid US Government sell-off scare
- Bitcoin price plunged below $92,000 on Thursday, on course to close trading at a 40-day low.
- US authorities approved the sale of 69,370 BTC seized from the Silk Road marketplace.
- Following a 10% price correction in the last 48 hours, BTC bulls have deployed $721 million in leverage to avert a breakdown below $90,000.
Bitcoin price dipped to $91,800 on Thursday, marking its lowest in 43 days, dating back to December 9. Derivatives markets data shows concentrated BTC long positions around the $90,000 mark, as bulls move to halt the downtrend.
Bitcoin losses hit 10% as markets price in $6.5B sell-off from US Government
Bitcoin price suffered a sharp decline, dropping over 10% within two days as the market volatility intensified on Thursday.
Investor sentiment, already fragile following hotter-than-expected JOLTs jobs data, faced another bearish shock as news surfaced of an impending $6.5 billion Bitcoin sell-off by the United States (US) Government.
The US Government has reportedly received clearance to liquidate 69,370 BTC seized from the infamous Silk Road marketplace.
Court documents revealed that Chief US District Judge Richard Seeborg denied a motion to block the forfeiture, allowing the Department of Justice to move forward with selling the crypto haul.
The scale of the sell-off has spooked traders, amplifying bearish headwinds in a week that began on a downtrend.
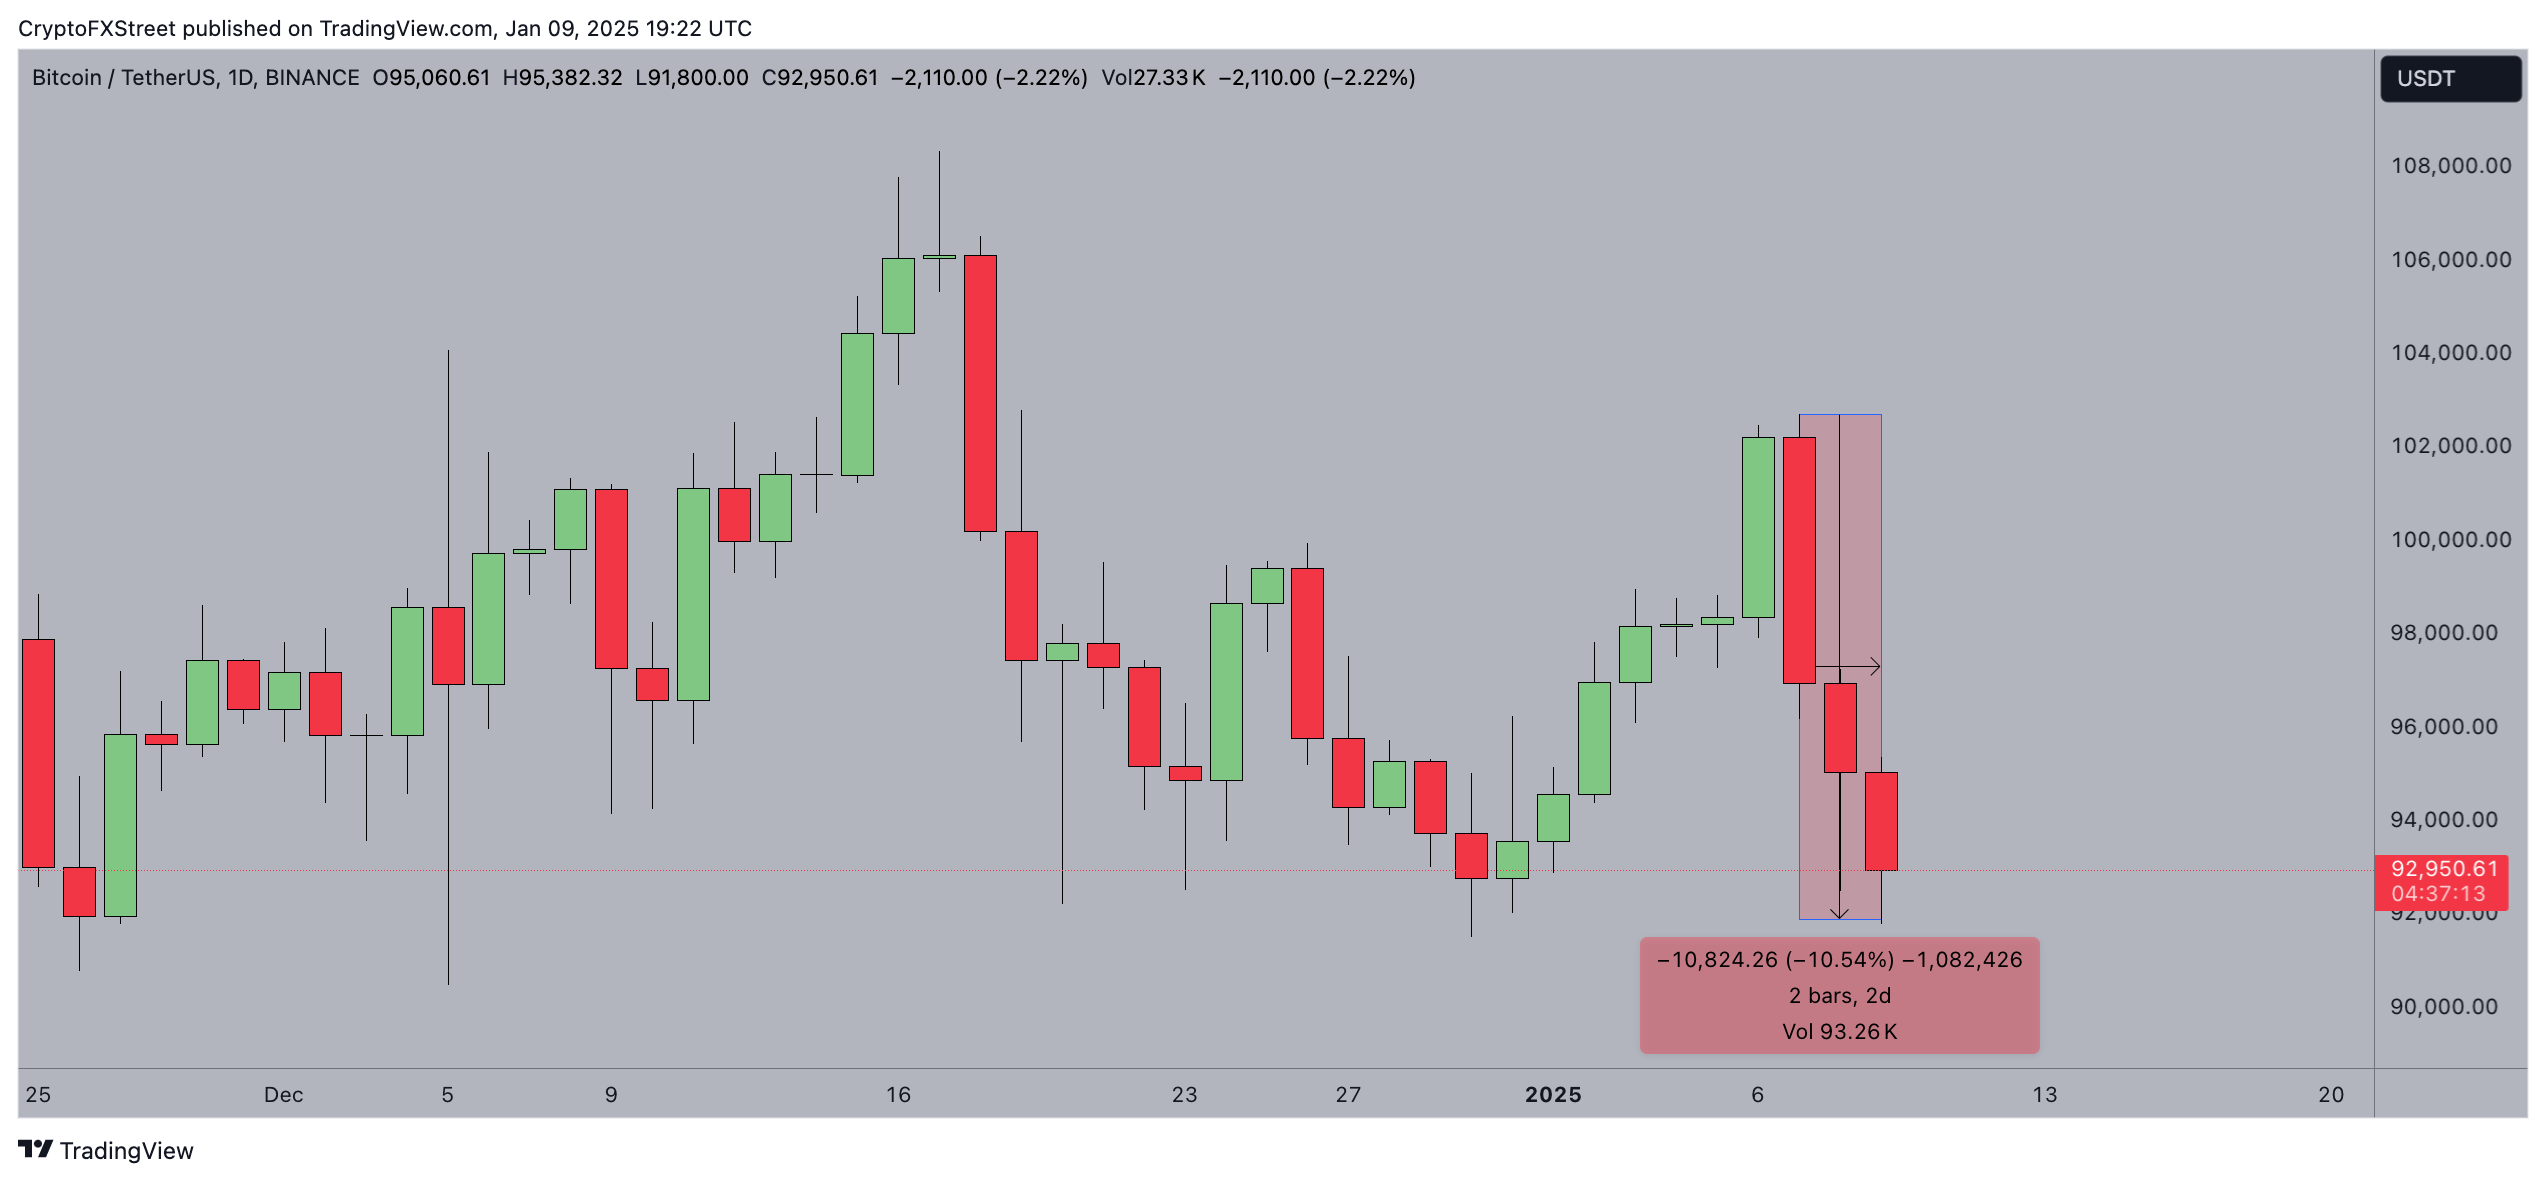 Bitcoin price action, January 8 2025. | BTCUSDT (Binance)
BTC price reacted swiftly, plunging from $95,060 to $91,800 as shown in the chart above.
Market speculation is now rife on if the sell-off occurs before President-elect Donald Trump's inauguration, who has campaigned on a pro-Bitcoin stance.
Trump's proposals include leveraging seized funds to establish a national Bitcoin reserve, adding an ironic twist to the gGovernment's crypto liquidation narrative.
Bulls mount $721 lLeverage to avert $90K breakdown
Following a 10.5% loss over the past two days, Bitcoin holders are making desperate moves to keep prices from falling below the critical $90,000 threshold.
While overall crypto market sentiment remains bearish, bullish traders are attempting to establish a support wall at this key level.
Coinglass’ Liquidation Map data highlights the total leverage deployed on long and short positions near significant price points.
This metric offers insight into pivotal BTC price support and resistance levels to monitor in the short term.
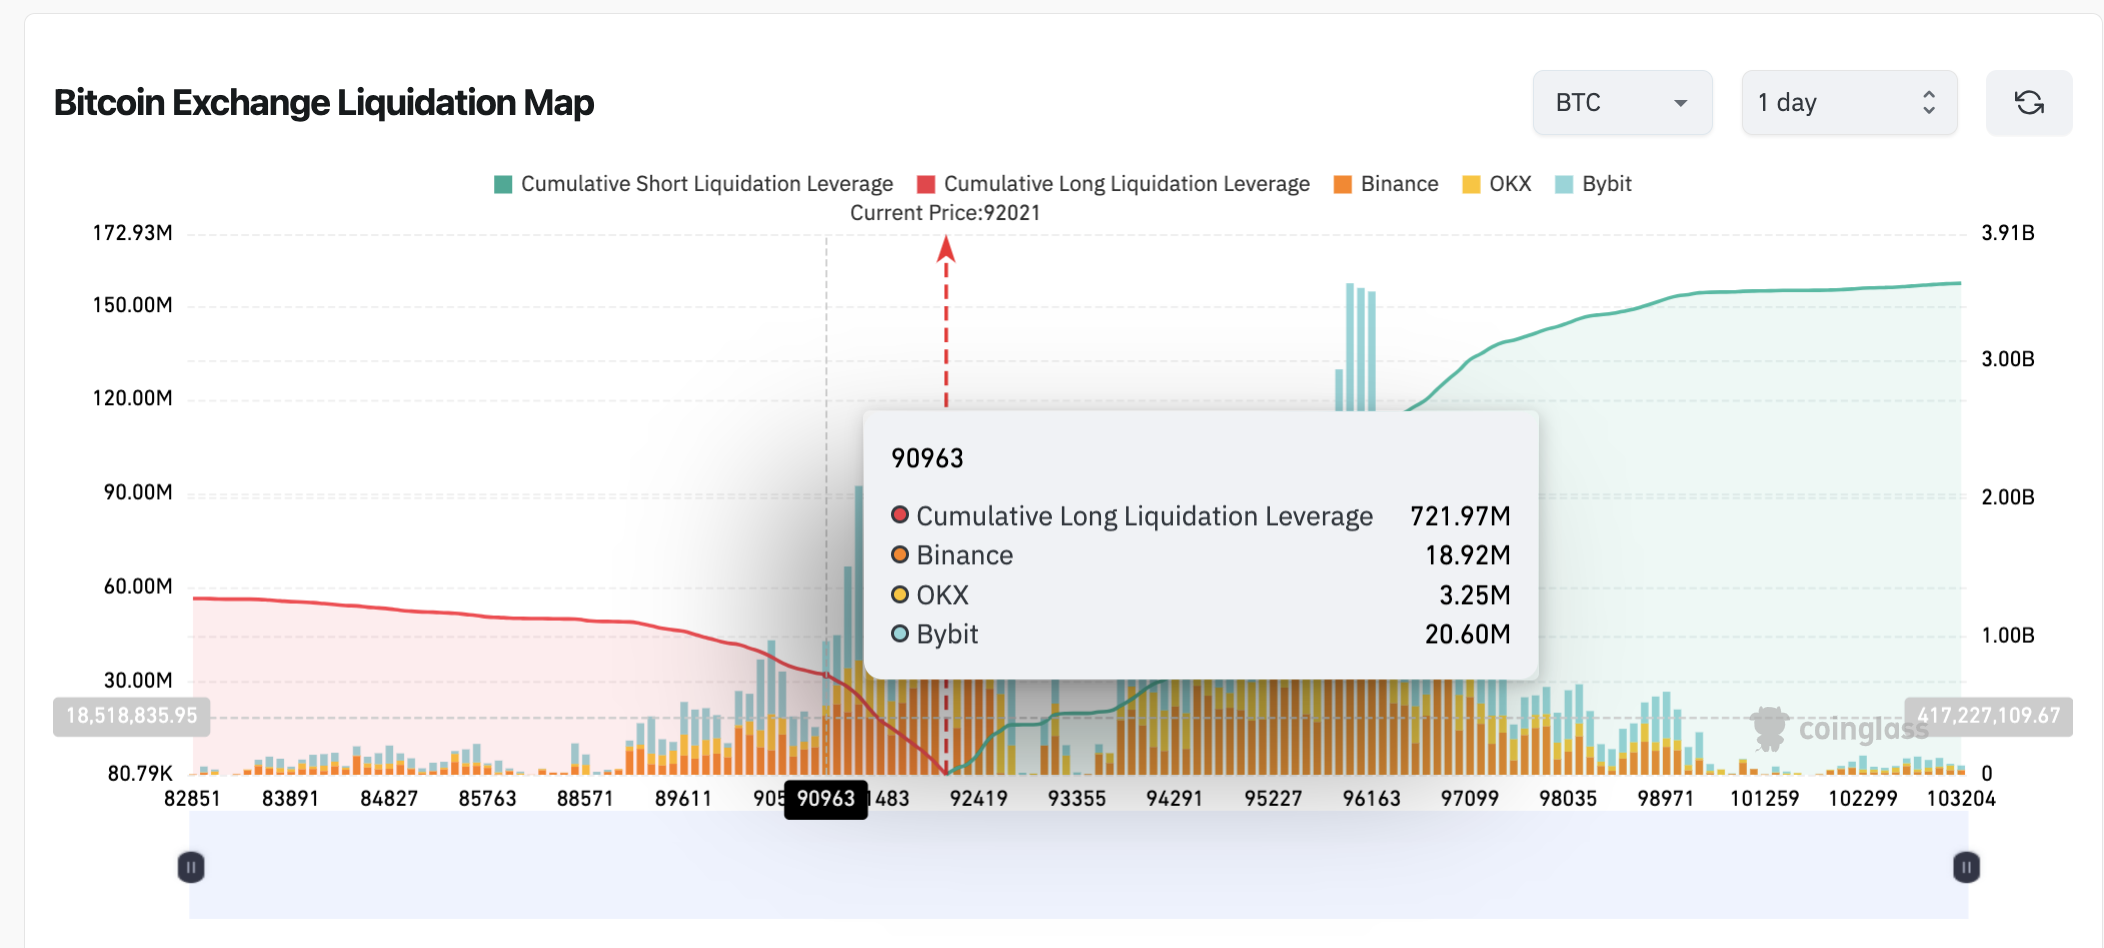 Bitcoin Liquidation Map | Coinglass
At first glance, the chart shows that short traders currently dominate, with over $3.55 billion in active short positions compared to $1.3 billion in long positions.
However, a closer look reveals that BTC bulls have concentrated over $721 million in active leverage positions around the $90,000 mark—accounting for nearly 60% of active long BTC futures contracts.
During market dips, large leverage positions near key price levels can prompt traders to make covering spot purchases to avoid liquidation losses.
Essentially, holders of the $721 million in BTC long contracts around $90,000 are now incentivized to make covering spot purchases.
If selling pressure eases, these covering buys could trigger a mild rebound in BTC prices in the coming days.
Bitcoin price forecast: Holding $90,000 support could trigger an early rebound
Bitcoin price outlook shows signs of a potential reversal as the double bottom pattern at $90,000 signals a possible rebound.
This technical formation, historically known for marking trend reversals, is further validated by the rising BTC trading volume, indicating heightened market participation and buying interest.
Beyond that, the VWAP (Volume Weighted Average Price) line trending above the current price also indicates buying pressure is building up.
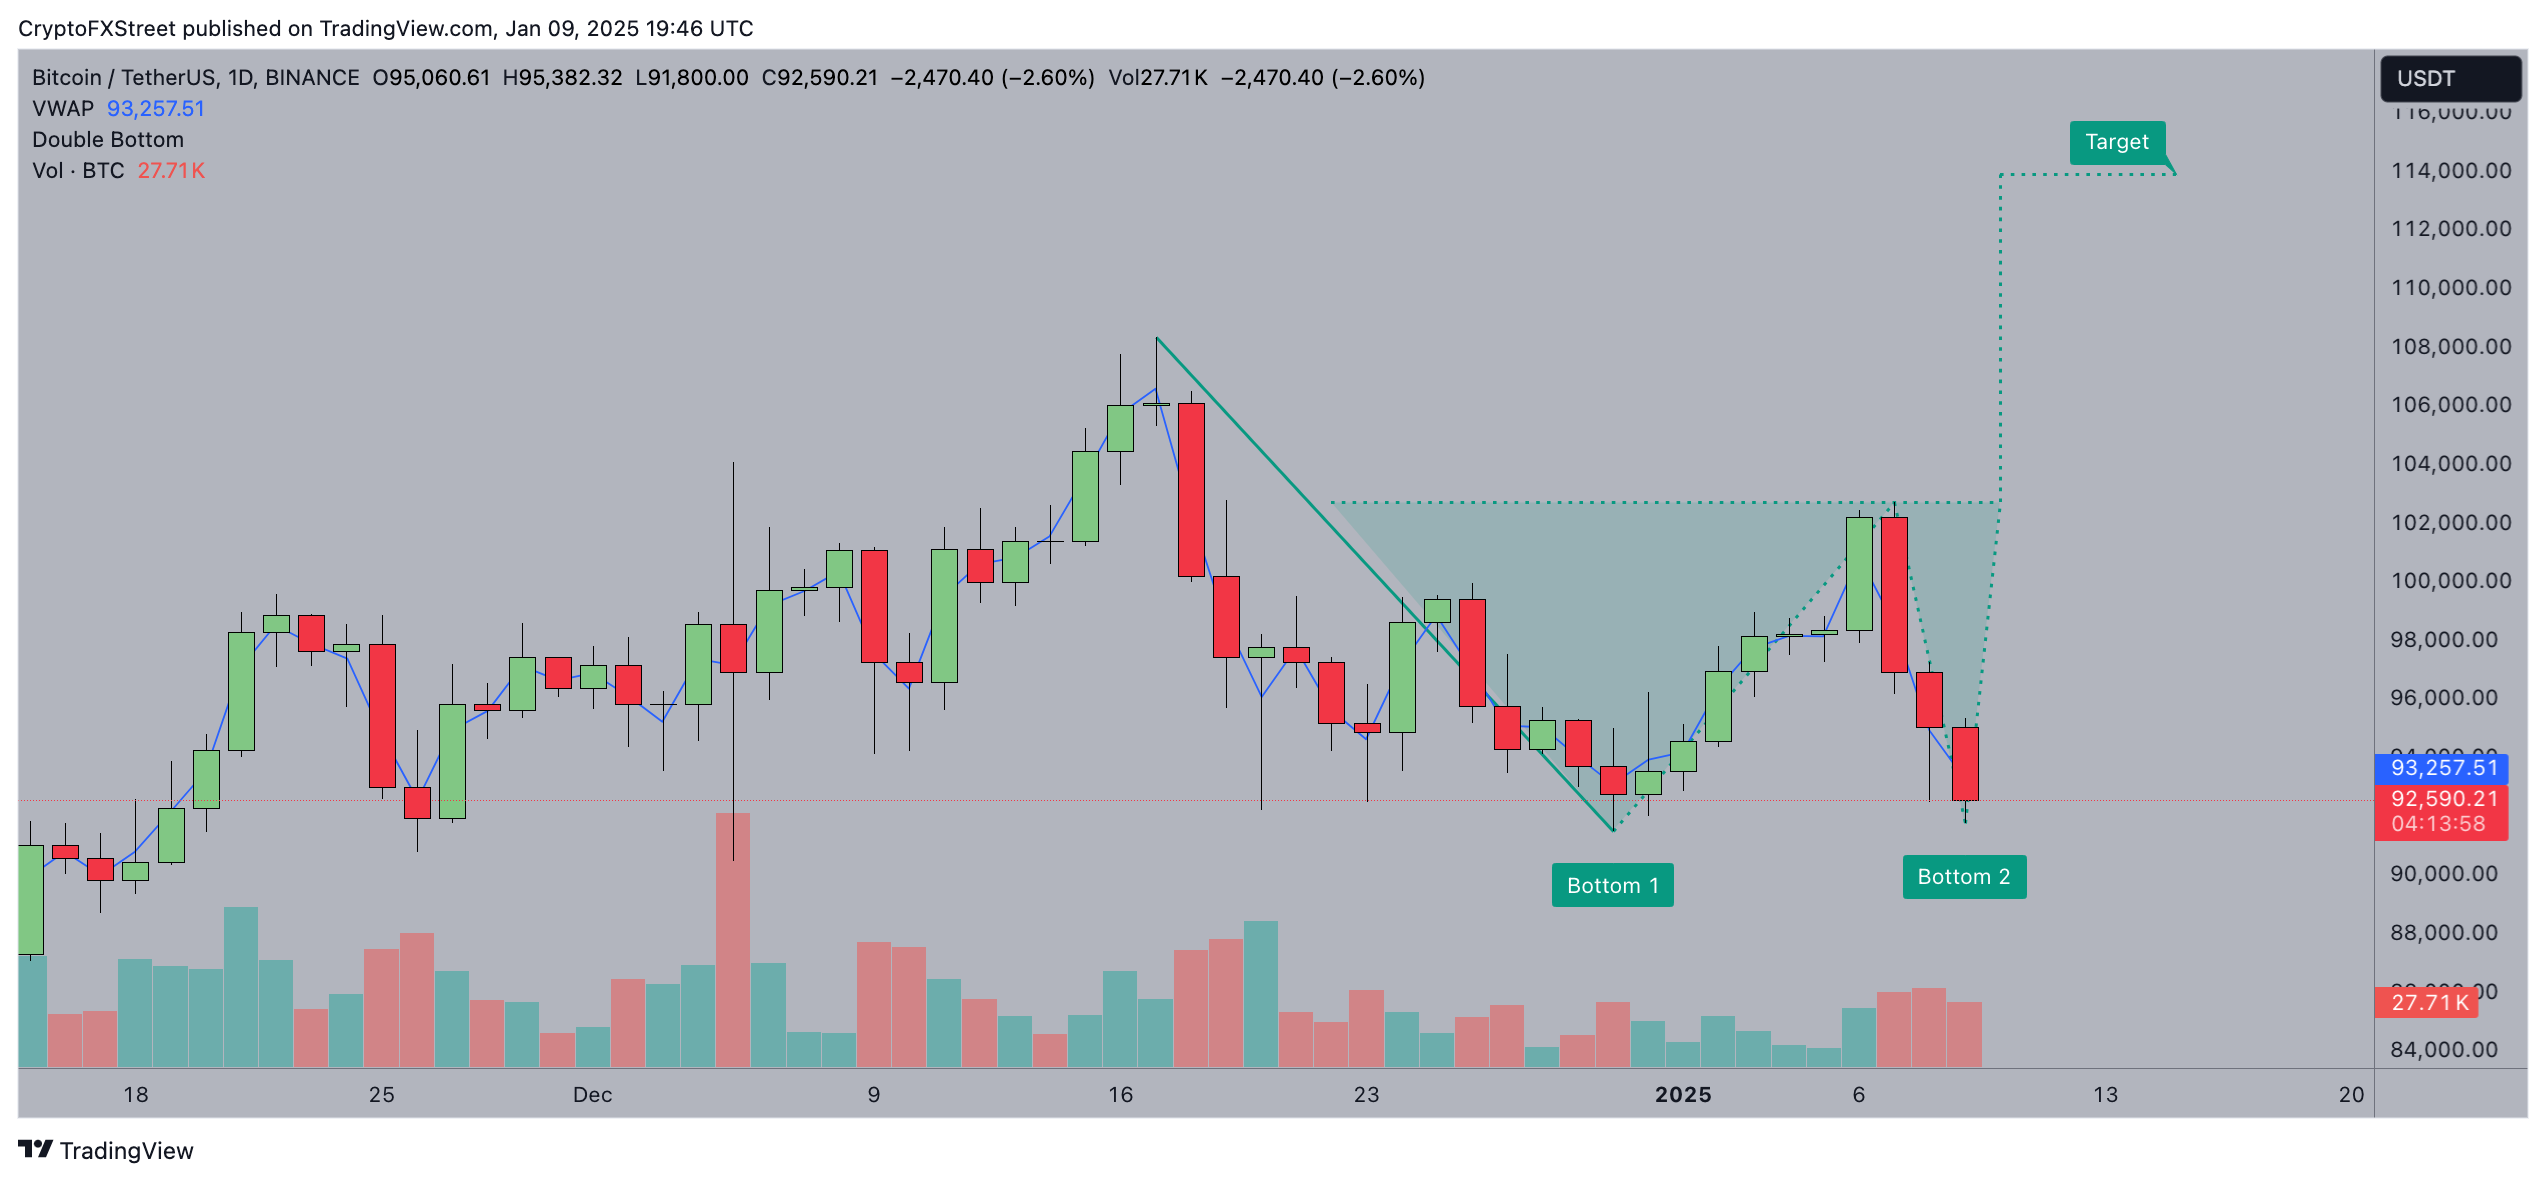 Bitcoin price forecast | BTCUSD
Conversely, bearish scenarios remain plausible if Bitcoin fails to sustain above the critical $90,000 support level.
The chart reflects dominance by short traders, with significant selling pressure that could drive prices lower.
A breakdown below this level would negate the double bottom’s bullish implications, potentially dragging BTC toward $84,000, where further liquidity may be tested.
For now, the double bottom and increasing volumes provide cautious optimism for a rebound.
A sustained break above $93,217 (VWAP level) could open the path toward $100,000, aligning with the bullish target implied by the double bottom structure.
Recommended Articles


